Fig. 6.
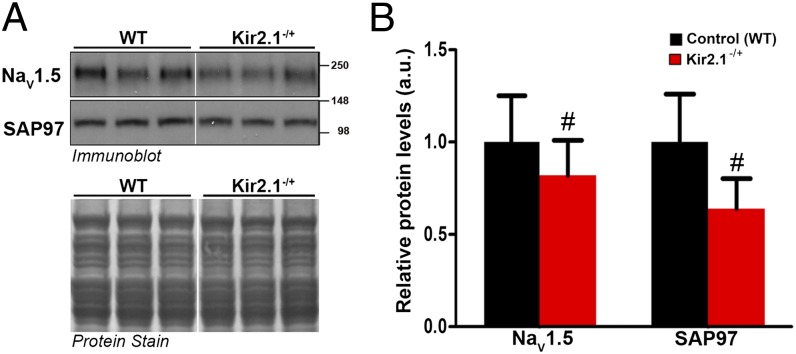
Transgenic reduction of Kir2.1 gene expression leads to a significant decrease in relative protein levels of NaV1.5 and SAP97. Crude membrane vesicles were prepared from the ventricles of control (WT) and Kir2.1−/+ mice. Fig. 5 has methods describing SDS/PAGE and immunoblotting. (A) Representative immunoblots after detection of protein immunoreactivity with HRP-conjugated secondary antibodies and chemiluminescence (Upper). The corresponding Amido Black nitrocellulose (protein stain) is shown in Lower to show analysis of equal total protein. Protein concentrations were also verified by Lowry assay. (B) Densitometric analysis comparing relative protein levels between WT and Kir2.1−/+ mice. Results are expressed as mean signal intensity (N = 7 per genotype, #P < 0.05, mean ± SEM).

