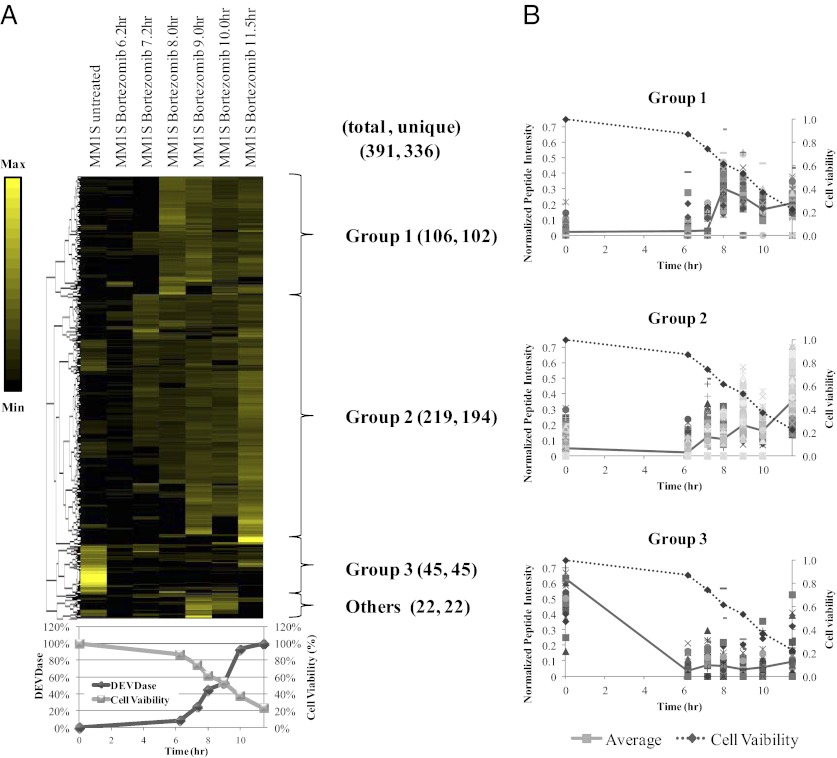
Fig. 3.
Profile of caspase-derived peptides from MM1S cells treated with bortezomib. (A) Heat map view for unbiased hierarchically clustered peptides. The peptides were normalized so that the sum of intensities across all points in the time course equaled 1. Using unbiased complete-linkage clustering, peptides were classified into three major groups (groups 1, 2, and 3, described in the text). (B) Plot of cell viability (dashed line) and the normalized peptide intensities (solid line) of each group.

