Fig. 1.
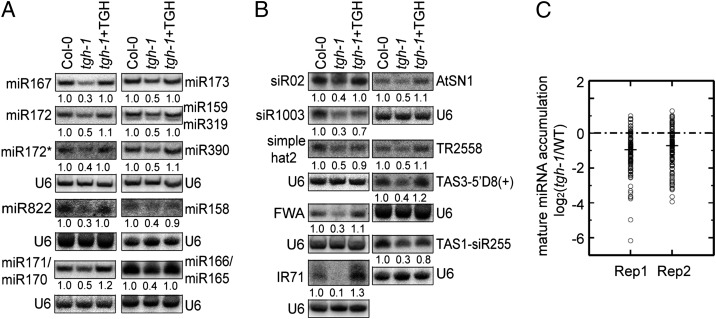
tgh-1 reduces the accumulation of miRNAs and siRNAs. (A) The accumulation of miRNAs and miR172* in three genotypes. (B) The accumulation of siRNAs in three genotypes. For miR159/319: Upper band, miR159; lower band, miR319 (34). The numbers indicate the relative abundance of small RNAs among the three genotypes and represent the mean of three repeats (P < 0.05). U6 blot was used as a loading control. Col-0, WT control for tgh-1; tgh-1+TGH, tgh-1 harboring TGH genomic DNA. (C) Deep sequencing analysis of miRNAs in tgh-1 and WT. Small RNA libraries were generated from inflorescences. The miRNA abundance was calculated as reads per million, and a log2-transformed ratio of tgh-1/Wt was plotted. Each circle represents one miRNA. Thick lines indicate median values.

