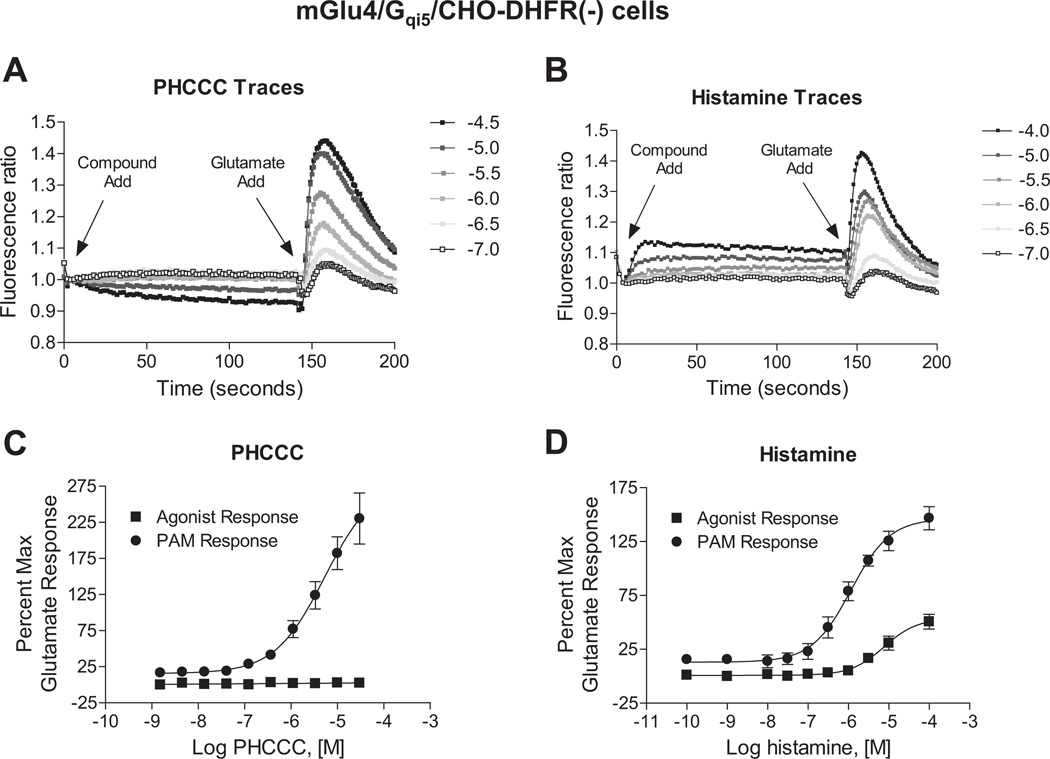
Fig. 1.
Histamine differs from the small molecule mGlu4 PAM, PHCCC, in its potentiation effect. A and B, fluorescence traces of PHCCC and histamine in calcium mobilization assays measured in CHO-DHFR(−) cells co-expressing mGlu4 and the chimeric G protein Gqi5 in cells. PHCCC (A, ranging from 100 nM to 30 µM) or histamine (B, ranging from 100 nM to 100 µM) was added in the “Compound Add”, while an EC20 concentration of glutamate (2.5 µM final) was added after 150 s in the “Glutamate Add”. C and D, Compound activity alone (Agonist Response) and PAM activity (PAM Response) in the presence of an EC20 concentration of glutamate (2.5 µM final) from traces represented in A and B are shown for PHCCC and histamine, respectively. For both responses, the increase in fluorescence units is normalized to the maximum response elicited by 1 mM glutamate in this cell line. PHCCC elicited no agonist response and possessed a potency of 5.1 ± 0.3 µM for the PAM response. The potency of histamine for the PAM response was 1.2 ± 0.4 µM and for the agonist response was and 8.3 ± 1.4 µM. Data shown were performed in triplicate; Mean ± SEM.

