Figure 6.

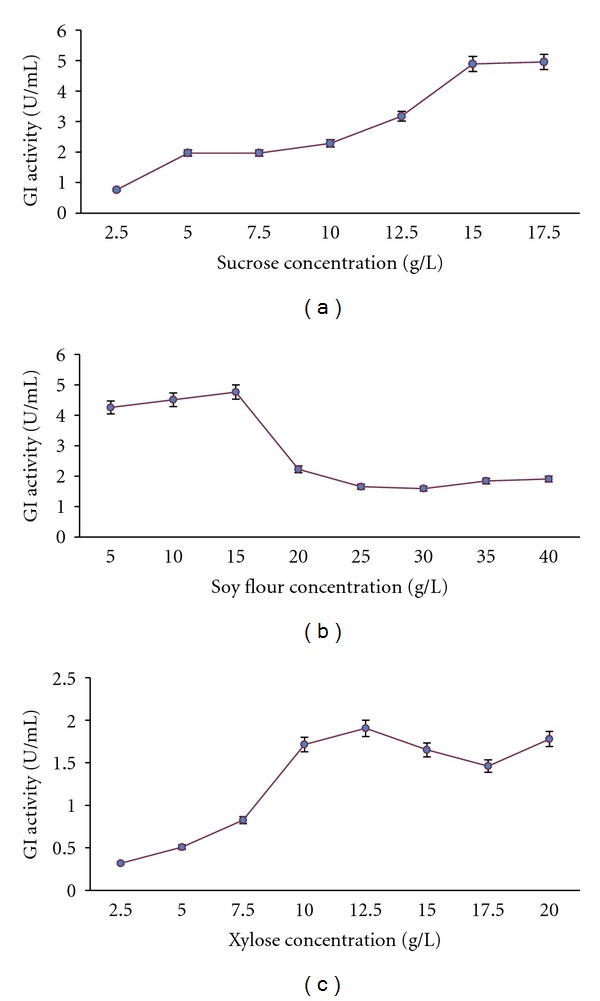
(a) Effect of varying concentration of carbon source on GI production. (b) Effect of varying concentration of nitrogen source soy flour on GI production. (c) Effect of varying concentration of xylose on GI production.

(a) Effect of varying concentration of carbon source on GI production. (b) Effect of varying concentration of nitrogen source soy flour on GI production. (c) Effect of varying concentration of xylose on GI production.