Figure 8.

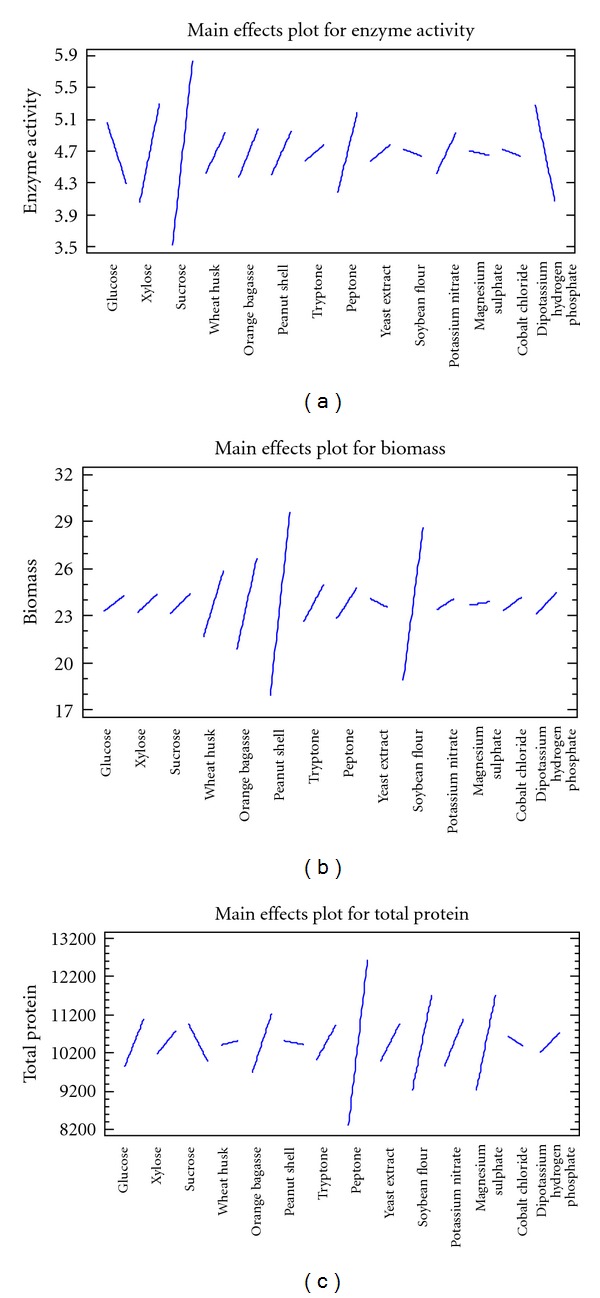
(a) Main effects plot for GI activity. (b) Main effects plot for biomass production. (c) Main effects plot for total protein.

(a) Main effects plot for GI activity. (b) Main effects plot for biomass production. (c) Main effects plot for total protein.