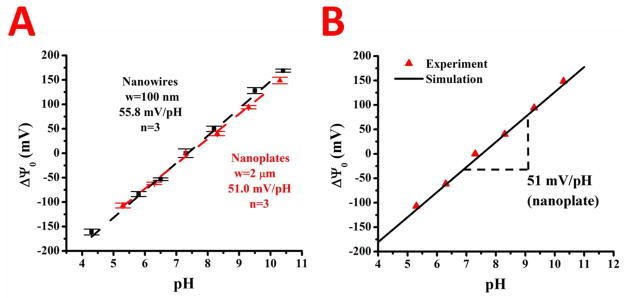
Figure 4.
The change in surface potential of the HfO2 sensing dielectric versus solution pH for nanowires (black) and nanoplates (red) is shown in A. The pH sensitivity for nanowires and nanoplates was extracted through linear regression and is displayed inset. Numerical simulations (black line) of the nanoplate data (red triangles) using self-consistent Poisson-Boltzmann electrostatics and an OH group site binding model is shown in B, with the extracted pH sensitivity inset.

