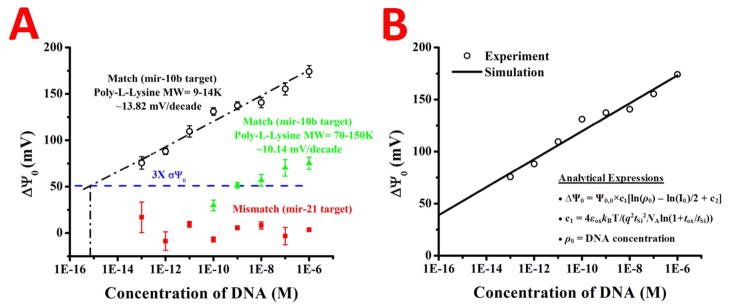
Figure 7.
The change in surface potential versus the concentration of target in solution is plotted in A for the two different poly-l-lysines, with the slopes of the respective lines calculated. The change in surface potential for the mismatched target is shown to be negligible (red squares) and a theoretical limit of detection line is drawn in blue. The linear regression for the PLL (9–14K) is shown in A (black dashed line) and extrapolated to the theoretical limit of detection line. The change in surface potential versus the DNA concentration for the PLL (9–14K) data was also theoretically calculated, and is shown in B. The change in the surface potential (black circles) matches the theoretical prediction (black line) well. The analytical expressions used for the calculation are inset in B. The parameters used in the theoretical calculation of Δ Ψ0 are: tSi = 55nm, tox (EOT) = 4.22nm, NA = 1015cm−3, and I0 = 3mM. The device specific parameters are Ψ0,0 = 58.3mV and c2=40.63.

