Fig. 4.
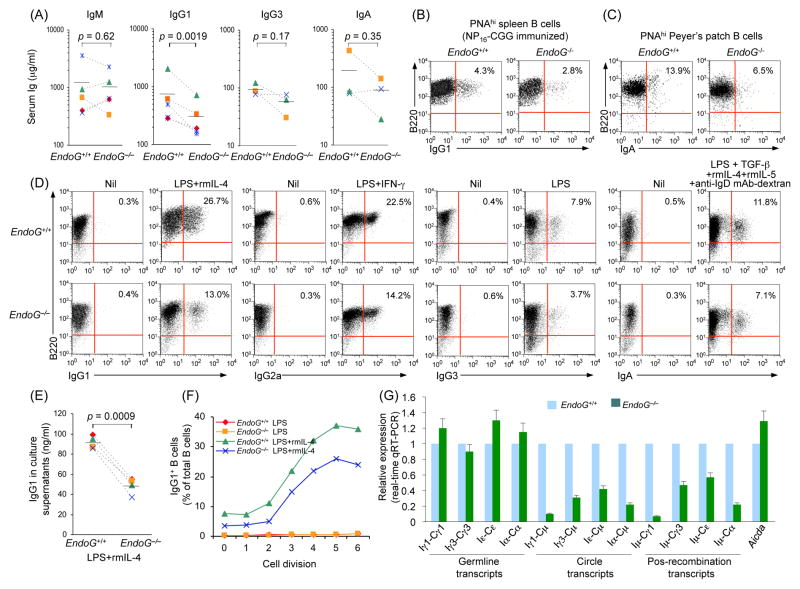
EndoG deficiency impairs CSR in vivo and in vitro. (A) Titers of circulating IgM, IgG1, IgG3 and IgA in unimmunized EndoG+/+ and EndoG−/− littermates. P values, paired t-test. Data are from five (IgM and IgG1) or three (IgG3 and IgA) pairs of EndoG+/+ and EndoG−/− mice. (B) Spleen cells from EndoG+/+ and EndoG−/− mice 14 days after immunization with NP16-CGG were stained with FITC-conjugated PNA, PE-labeled anti-B220 mAb and APC-labeled anti-IgG1 mAb; the sIgG1+ B cells among germinal center (PNAhiB220+) B cells were analyzed by flow cytometry. (C) Cells from Peyer’s patches of 12 week-old unimmunized EndoG+/+ and EndoG−/− mice were stained with Alexa Fluor® 647-labeled PNA, PE-labeled anti-B220 mAb and FITC-labeled anti-IgA mAb; sIgA+ B cells among germinal center (PNAhiB220+) B cells were measured by flow cytometry. Data are representative of three independent experiments. (D) Spleen EndoG+/+ and EndoG−/− B cells were stimulated with LPS in the presence of nil (for CSR to IgG3), rmIL-4 (for CSR to IgG1), IFN-γ (for CSR to IgG2a), or TGF-β1/rmIL-4/rmIL-5/anti-IgD mAb-dextran (for CSR to IgA). After a 4-day culture, the cells were stained with PE-anti-mouse B220 mAb and FITC-anti-mouse IgG1, IgG2a, IgG3, or IgA mAb for cell surface analysis (the number inside each panel indicates the percentage of B220+ cells that are positive for the indicated Ig isotypes). (E) IgG1 titers in supernatants of cultures of EndoG+/+ and EndoG−/− B cells stimulated for 4 days with LPS and rmIL-4. P values, paired t-test. Data are from B cells of four pairs of EndoG+/+ and EndoG−/− mice. (F) EndoG+/+ and EndoG−/− B cells were labeled with cell division-tracking fluorochrome CFSE and stimulated with LPS or LPS and rmIL-4 for 4 days. CFSE intensity and surface IgG1 expression were analyzed by flow cytometry. Proportion of surface IgG1+ B cells at each cell division is indicated. (G) EndoG deficiency does not alter Aicda expression and germline IH-CH transcripts but decreases CSR as indicated by the lower expression of circle IH-Cμ and post-recombination Iμ-CH transcripts. Real-time qRT-PCR analysis of Aicda expression, germline IH-CH, circle IH-Cμ and post-recombination Iμ-CH transcripts in EndoG+/+ and EndoG−/− splenic B cells cultured for 3 days with LPS alone (Iγ3-Cγ3, Iγ3-Cμ and Iμ-Cγ3), or with LPS and rmIL-4 (Aicda, Iγ1-Cγ1, Iγ1-Cμ, Iμ-Cγ1, Iε-Cε, Iε-Cμ and Iμ-Cε) or LPS and TGF-β/rmIL-4/rmIL-5/anti-IgD mAb-dextran (Iα-Cα, Iα-Cμ and Iμ-Cα); expression is normalized to Cd79b expression and is presented relative to the expression in EndoG+/+ B cells, set as 1.

