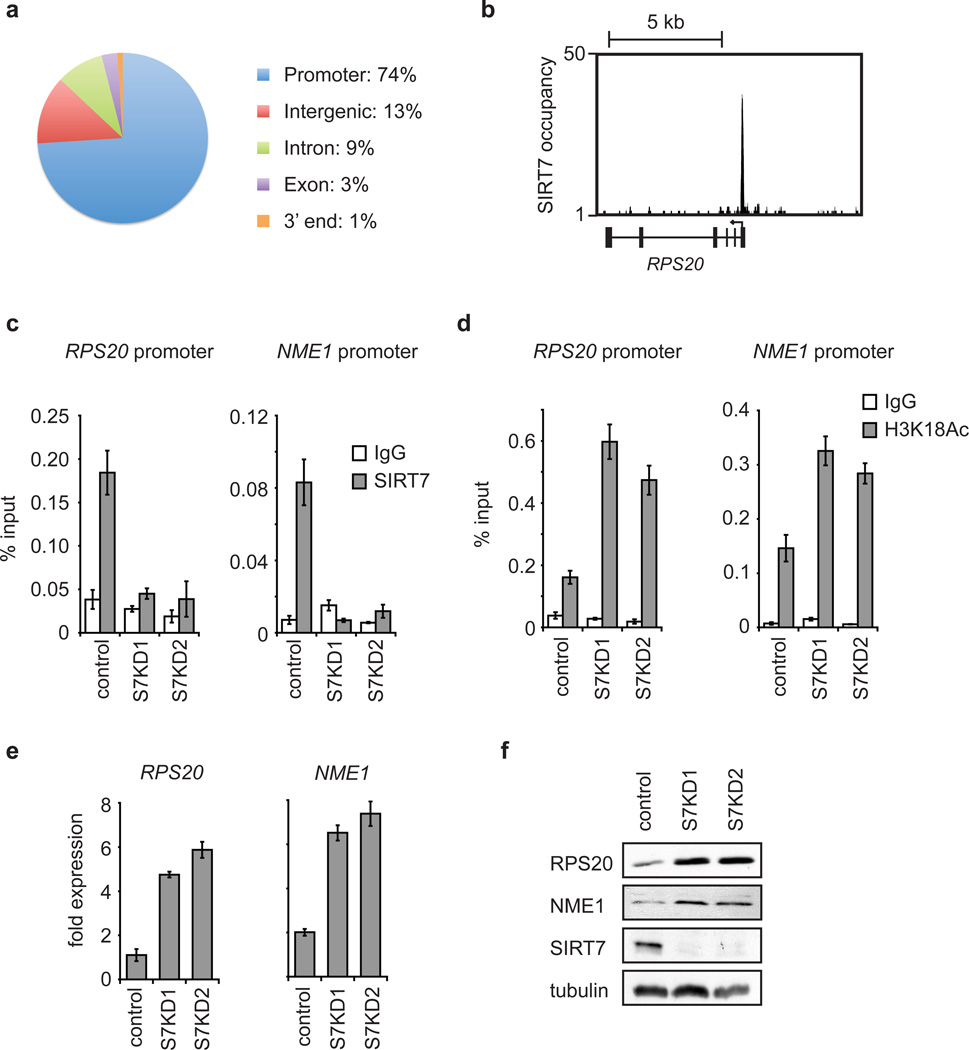
Figure 2. SIRT7 binds to gene promoters and couples H3K18 deacetylation to transcriptional repression.
a, Enrichment of SIRT7 in promoter proximal regions, determined by ChIP-sequencing. b, Representative SIRT7 ChIP-sequencing peak at the RPS20 gene TSS (arrow). c, ChIP-qPCR (mean +/− S.E.M.) showing SIRT7 occupancy in control or SIRT7 knockdown (S7KD1, S7KD2) HT1080 cells, compared to IgG negative control samples. d, ChIP-qPCR (mean +/− S.E.M.) showing H3K18Ac hyperacetylation in S7KD HT1080 cells. e, Increased expression of SIRT7 target genes in S7KD HT1080 cells determined by qPCR (mean +/− S.E.M.). Signals were normalized to GAPDH expression. f, Western blots of cell extracts corresponding to samples in e.

