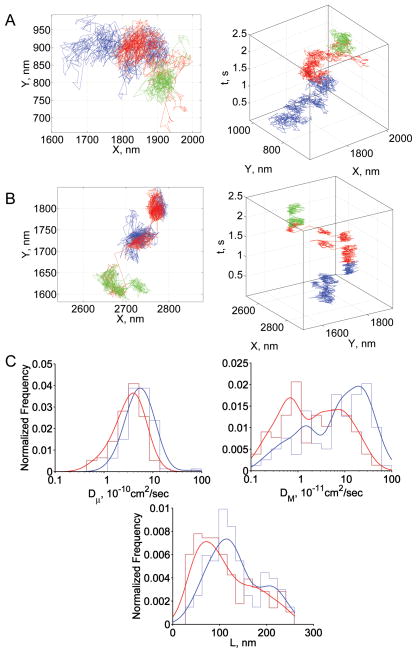
Fig 5.
Summary of CD58 results. (A) Representative trajectory in normal RBCs; (B) representative trajectory in SAO RBCs; (C) diffusion parameter distributions: blue, normal RBCs; red, SAO RBCs; L was calculated only from trajectories showing confined or tightly confined motion. In panels A and B, blue, red, and green steps represent the initial, middle, and terminal portions of the trajectory, respectively. In panel C, envelope smoothing functions are overlaid on histograms of experimental data.

