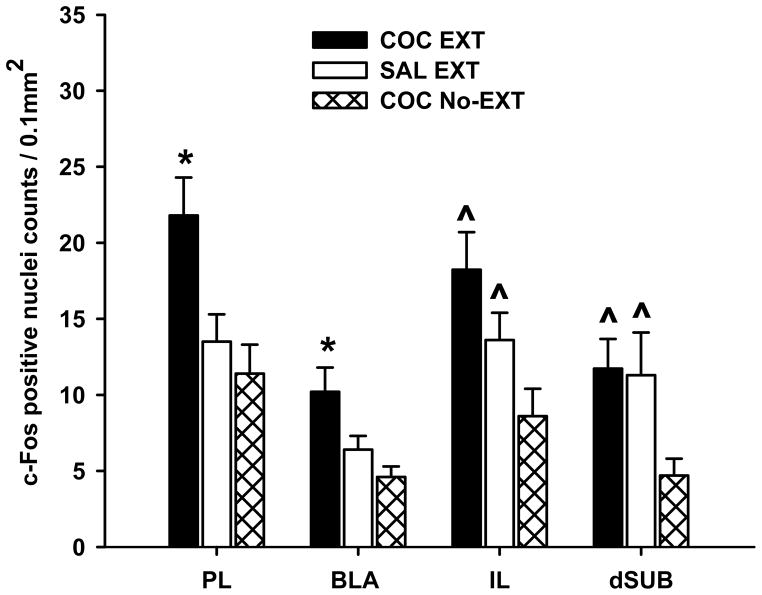
Figure 3.
Expression of c-Fos protein after cocaine-cue extinction (COC EXT) and control training (SAL EXT or COC No-EXT). Values are the mean ± SEM number of c-Fos-positive cell counts per 0.1 mm2 in brain regions where significant differences were found. * p<0.05 compared to SAL EXT and COC No-EXT control groups; ^ p<0.05 compared to the COC No-EXT control group.

