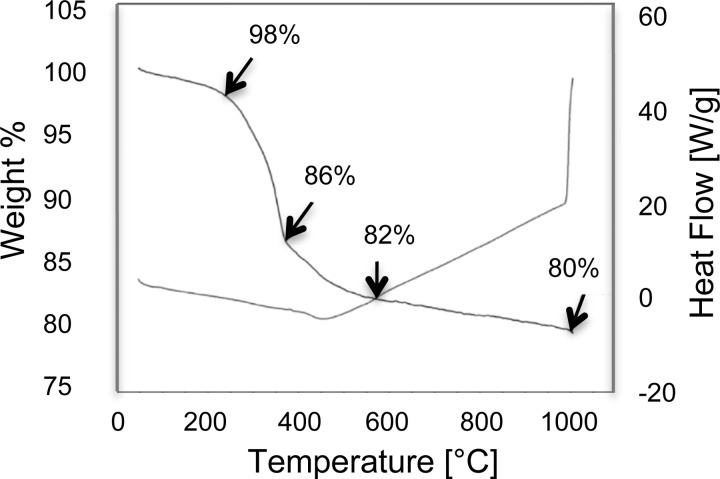
FIG. 2.
Weight loss and heat flow curves for SIPP#1. Dried SIPPs were added to TGA sample cups and heated at 20 °C/h from room temperature to 1000 °C. The weight percent of organic coating and naked FePt was then extrapolated. The curve labeled with arrows shows the decrease in weight percent while the unlabeled curve shows the heat flow.

