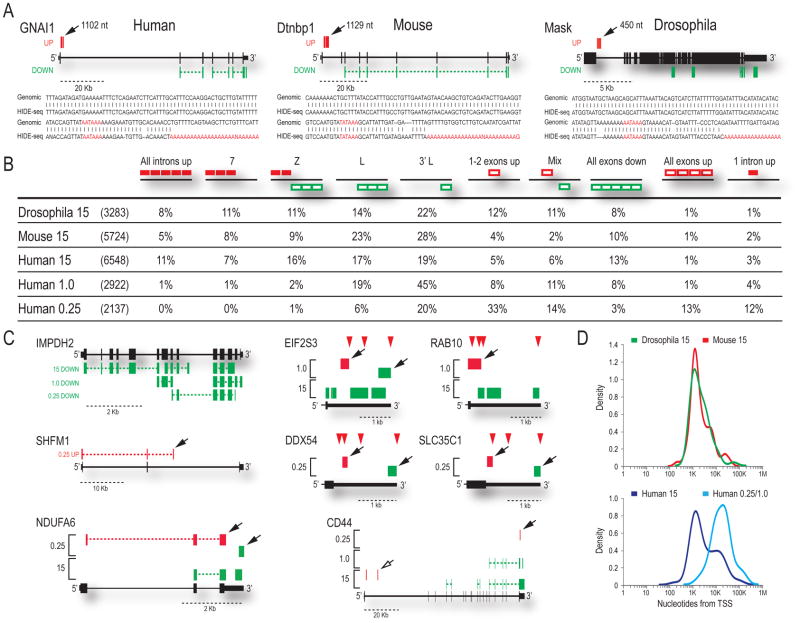
Figure 2. Transcriptome profiles show a conserved function of U1 snRNP in PCPA suppression.
(A) HIDE-seq profiles are shown along with sequences of poly(A) reads (location indicated by solid arrows) aligned to the genome for S2, NIH/3T3, and HeLa. Distance (nt) is relative to the upstream 5’ss with the PAS hexamer likely used and stretches of A’s added to HIDE-seq reads in red. See also Supplemental Figures S2–S4. (B) Illustrations of patterns observed (depicted above each column; e.g. Z: red up then green down) after U1 AMO with the percentage of each category reported for Drosophila (15), mouse (15) and human at three doses (15, 1.0, 0.25) compared to the total number of affected genes in parenthesis. Introns = solid red boxes; exons = empty boxes. (C) Individual examples of patterns described in Figure 2B are shown with brackets indicating results from more than one concentration. Solid arrows indicate reads ending in poly(A) tails; open arrows are inferred PCPA; red triangles are documented PASs. (D) Using reads with poly(A) tails terminating in introns (Figures S2–S5), the distribution of distances of PCPA relative to the TSS are plotted for Drosophila and mouse (top), and human at high and low U1 AMO (bottom).

