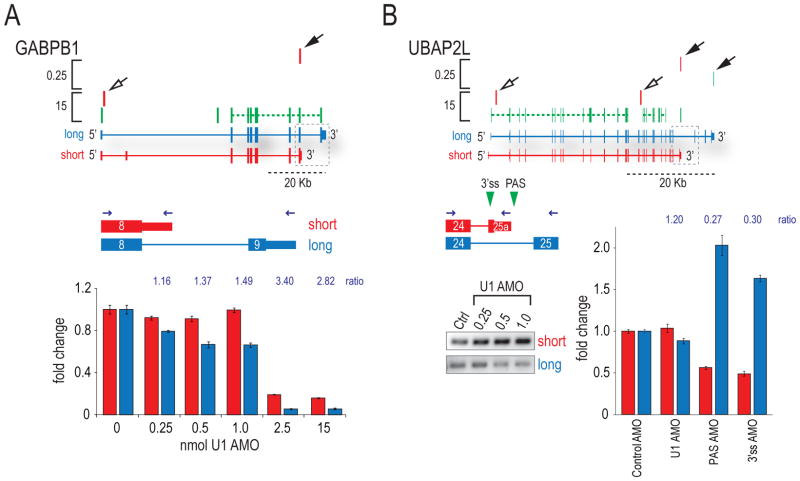
Figure 3. Moderate U1 reduction-induced PCPA regulates expression of short isoforms.
(A) HIDE-seq profile for GABPB1 at high and low U1 AMO are above diagrams of long (blue) and short (red) isoforms. RT-qPCR of short and long isoforms was performed on cDNA from cells transfected with a range of U1 AMO concentrations using a common forward and different reverse primers as indicated (blue arrows). Grey dotted boxes indicate region of transcript probed. Ratios of short to long are reported above histograms. (B) UBAP2L was probed by RT-PCR for short (due to 3′ exon switching) and long isoforms (gels) and by RT-qPCR on cDNA from cells treated with various AMOs. Green triangle = 3’ss and PAS AMOs, black arrows = poly(A) reads; open arrows = inferred PCPA.

