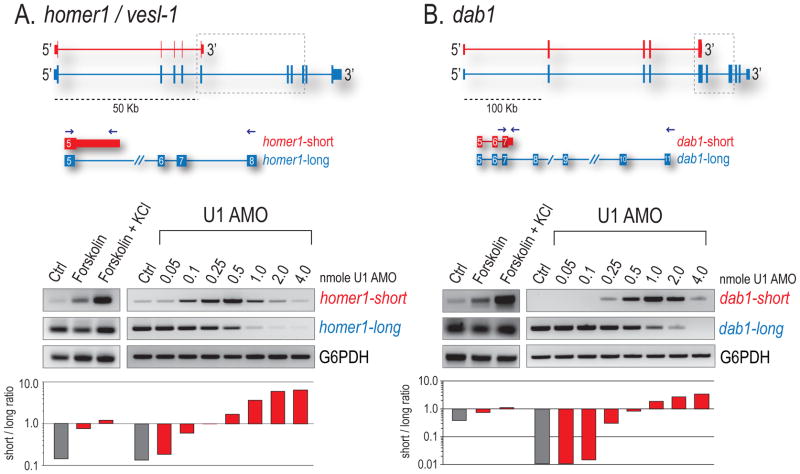
Figure 5. Moderate U1 reduction recapitulates isoform switching upon neuronal activation.
Rat PC12 (A) and mouse MN-1 (B) neurons were stimulated with forskolin or forskolin/KCl for 3 hrs or separately transfected with control AMO or increasing amounts of U1 AMO. RT-PCR detecting short and long forms of Homer-1/Vesl-1 and Dab-1 are shown with histograms depicting the ratio of S/L. Grey dotted boxes indicate the region of transcript probed, blue arrows show primer locations, and G6PDH is a loading control.

