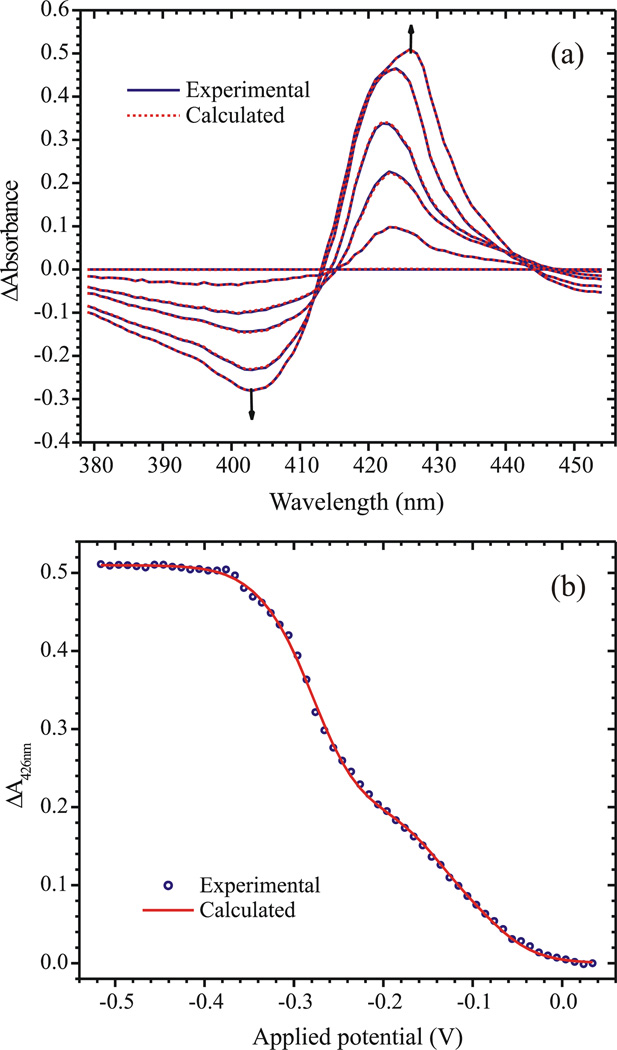
Figure 3.
(a) Spectra obtained at applied potentials of 0.034V, −0.106V, −0.196V, −0.256V, −0.316V and −0.506V vs SHE. Solid blue lines show the experimentally obtained data, while the dashed red lines show the fit obtained using the matrix Eq. 6 (b) The least-squares best fit of the data by Eq. 6 at λ=426 nm.

