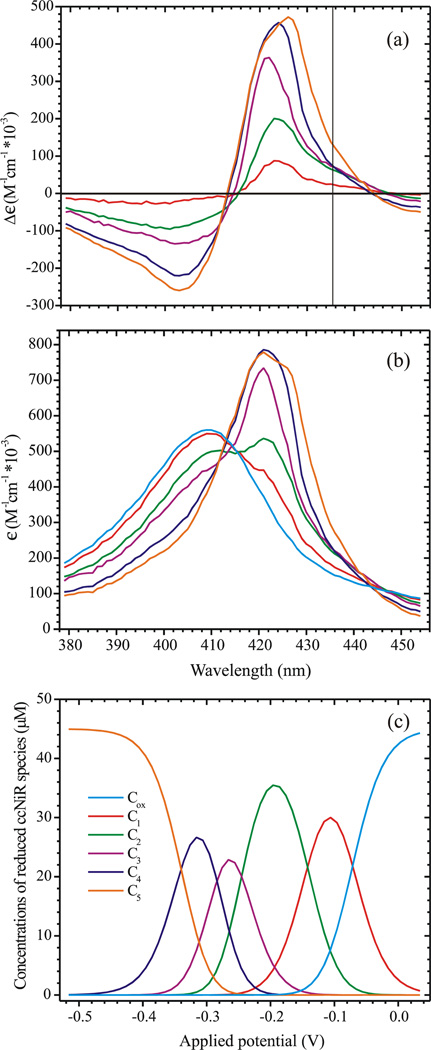
Figure 4.
(a) Extinction coefficient difference spectra corresponding to each of the reduced ccNiR species C1 – C5 (Scheme 2), as calculated by fitting the experimental spectropotentiometric titration data using Eq. 6. The vertical line shows the point at which a high-spin ferroheme should have an absorbance maximum. (b) Similar to (a), but here the calculated absolute extinction coefficient spectra of C1 – C5, together with the spectrum of Cox, are shown. (c) Concentrations of the various ccNiR species present in solution at a given applied potential (vs SHE), obtained by fitting the data to Eq. 6.

