Figure 5.
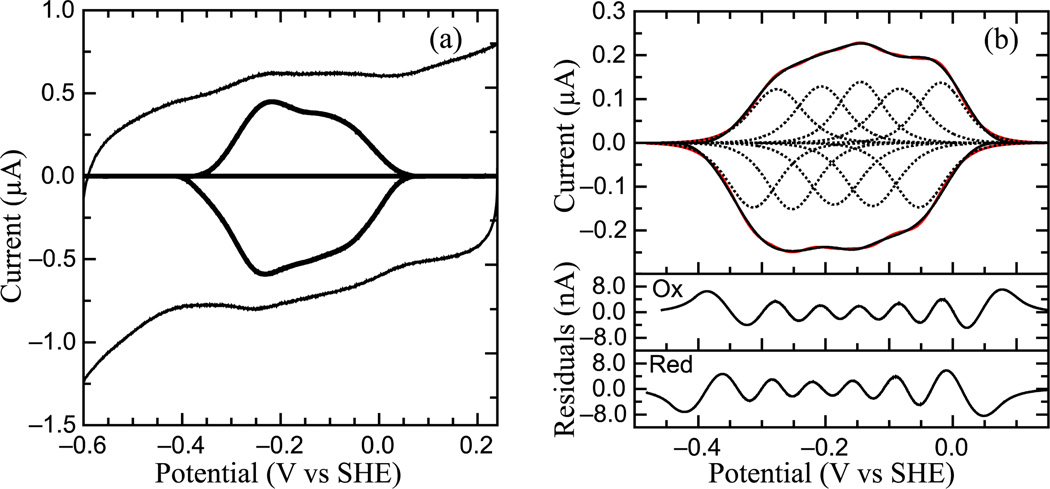
Protein Film Voltammetry of S. oneidensis ccNiR. (a) Typical signal on a graphite electrode. Experiment was carried out at pH 5.15, 0°C, scan rate 45 mV/s. Both the full cyclic voltammogram and background-subtracted data are shown. (b) Baseline-subtracted non-turnover voltammogram recorded at 0°C, pH 6, 250 mV/s. Black trace is the baseline-subtracted voltammogram, red trace and dotted lines are from the resulting fit; equation for fitting derived from the Nernst equation. Sub-plots show the residuals for fits of the oxidative (Ox) and reductive (Red) scans. Calculated Em values are −0.295 V, −0.230 V, −0.166 V, −0.105 V, and −0.036 V vs. SHE.

