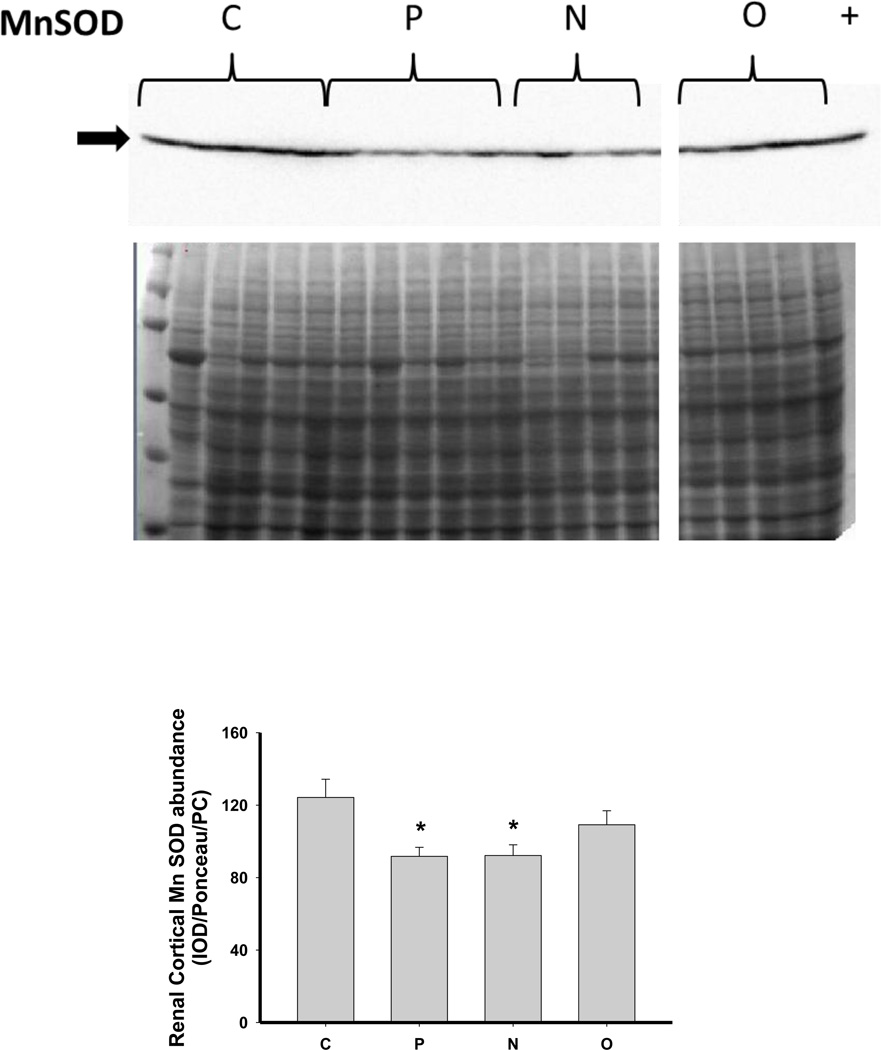
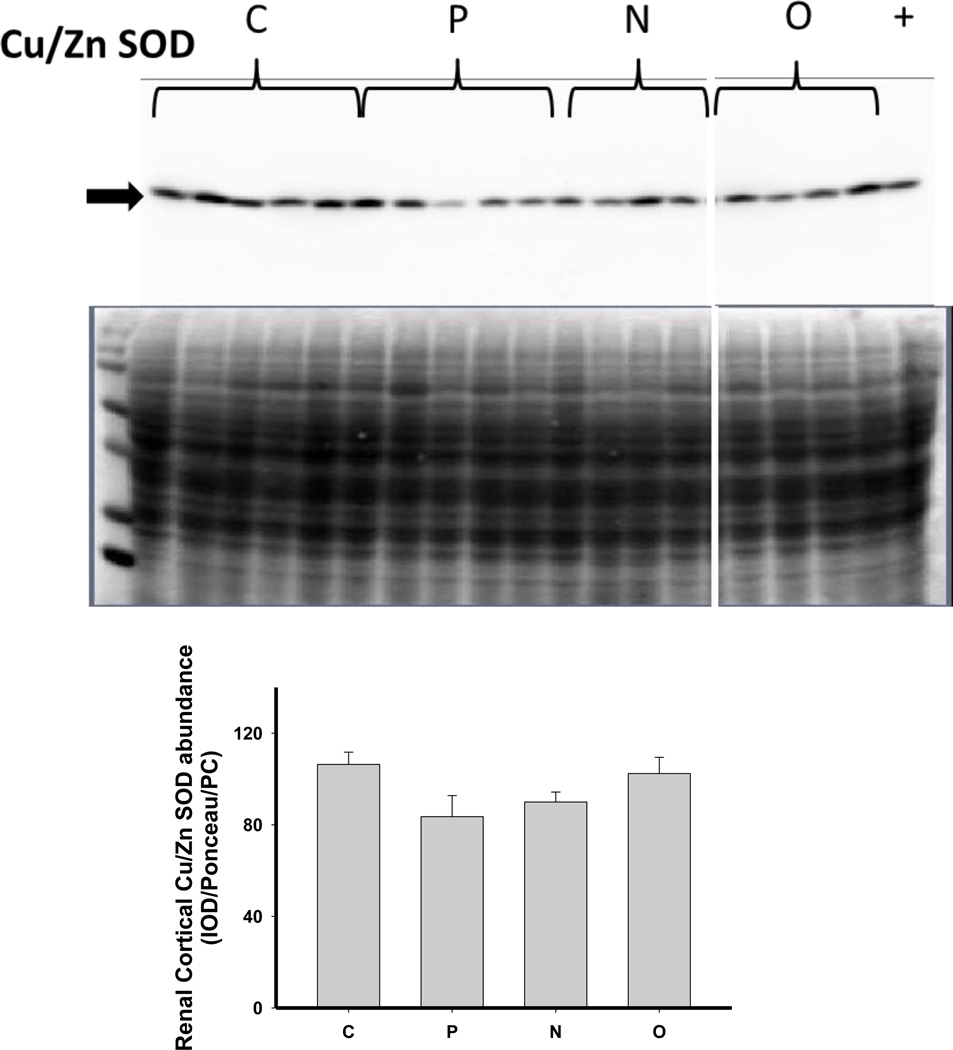
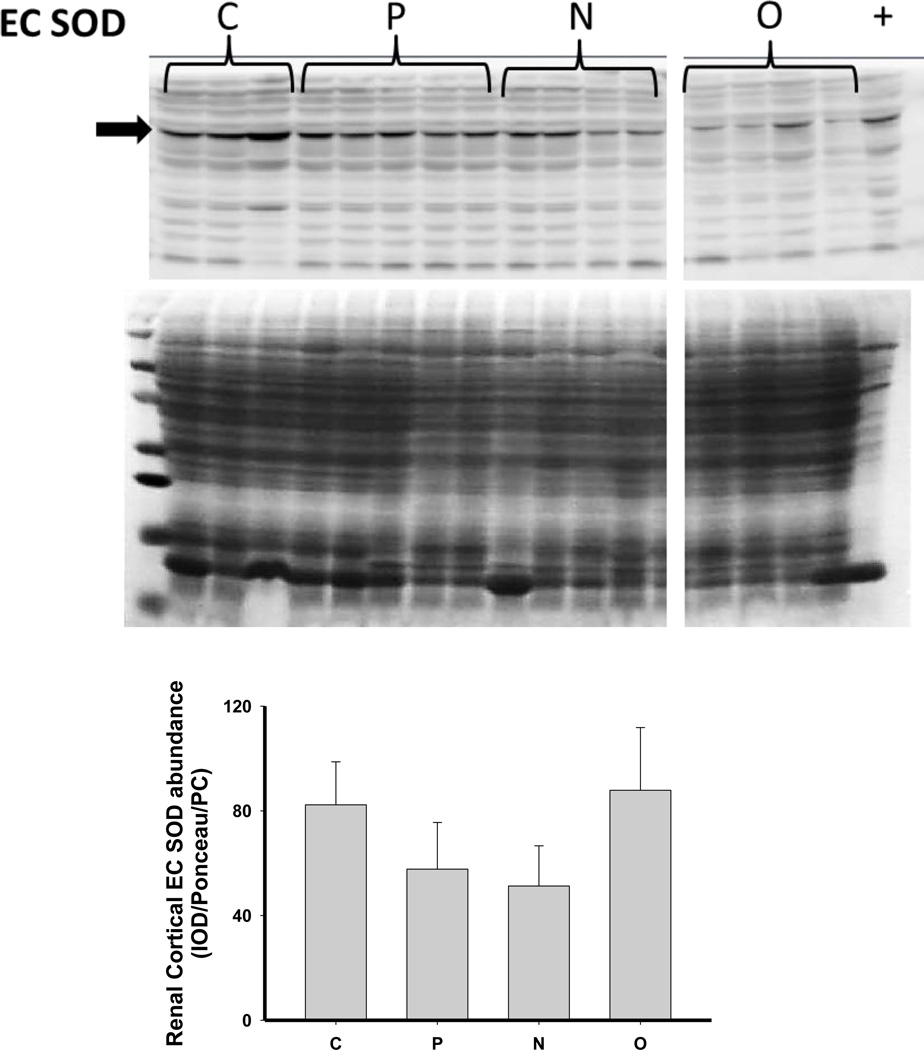
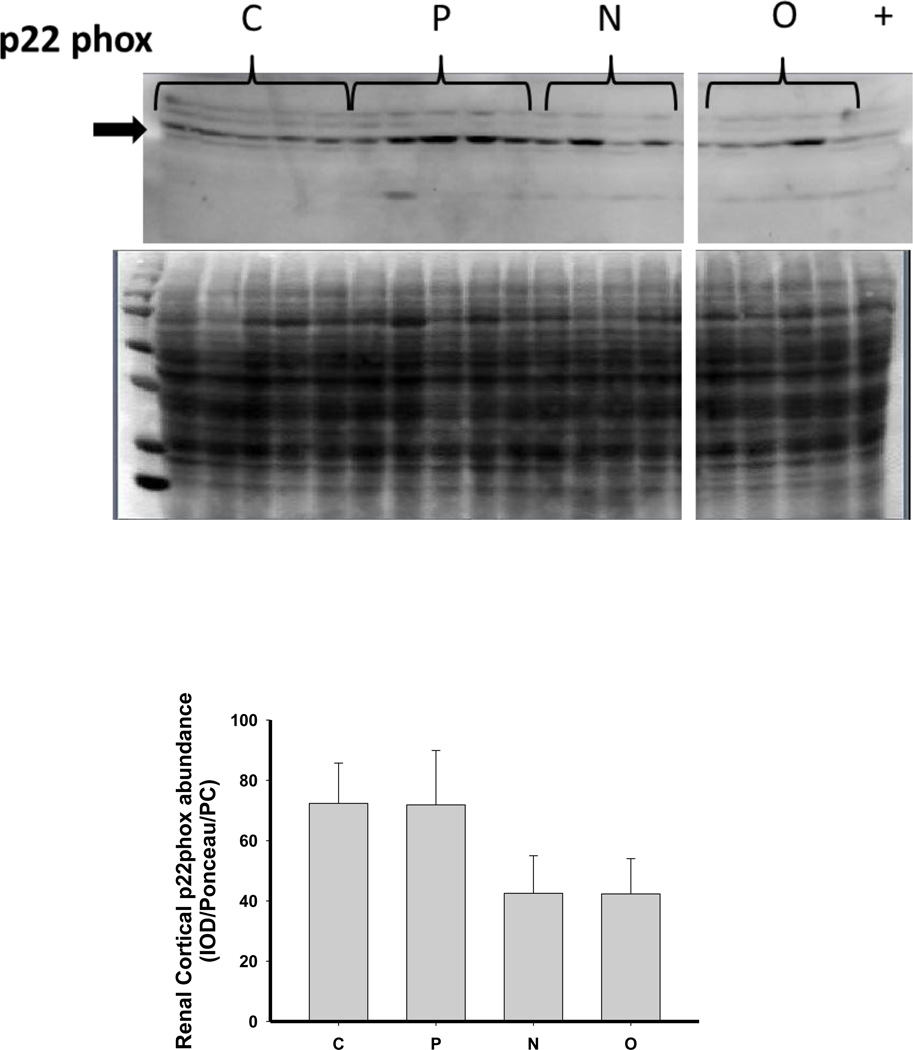
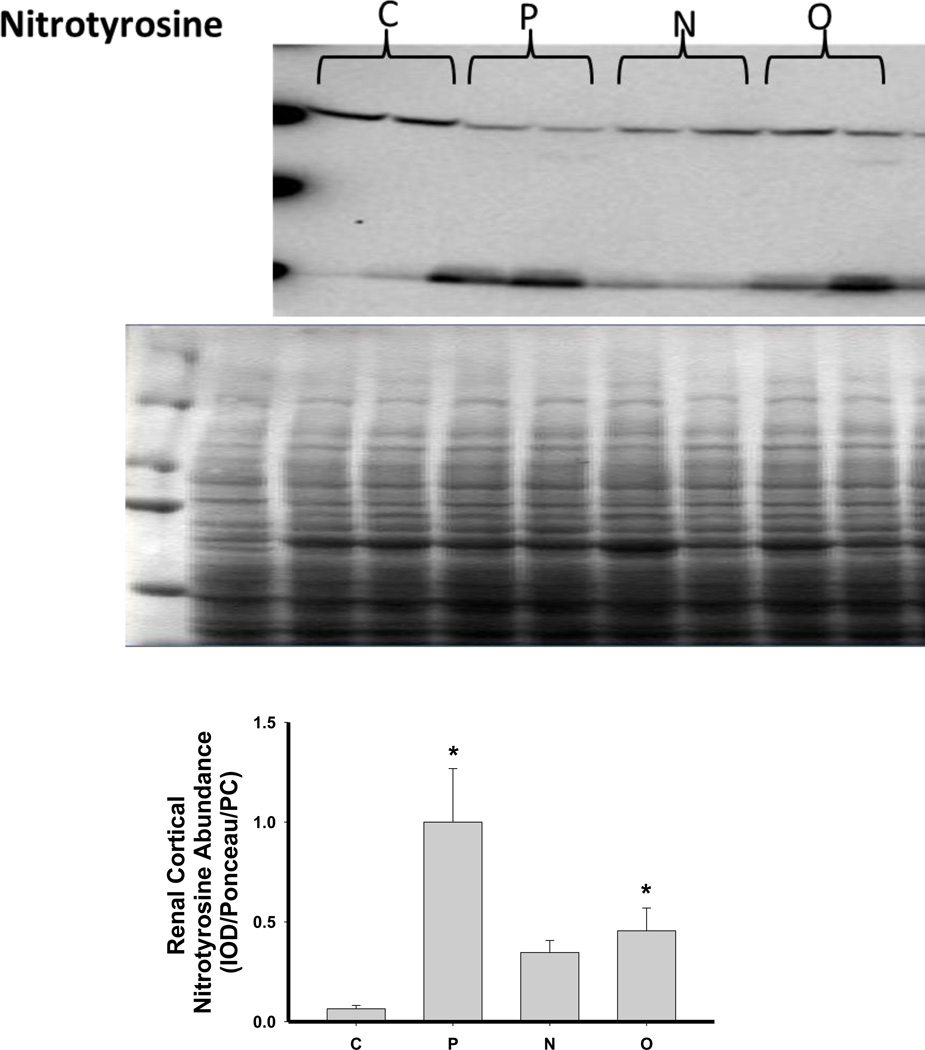
Figure 6.
Representative Western blots, representative images of total protein loading (ponceau red staining), and protein abundance (factored for total protein loaded and a positive control) in kidney cortex of extracellular superoxide dismutase (EC SOD), copper zinc (CuZn; cytosolic) SOD, manganese (Mn; mitochondrial) SOD, the p22phox subunit of NADPH oxidase, and nitrotyrosine in placebo treated (P), Nebivolol treated (N), and Olmesartan treated (O) rats 6 weeks after 5/6 renal ablation/infarction and age-matched control (C) rats. n=6–10. * denotes p<0.05 vs C.

