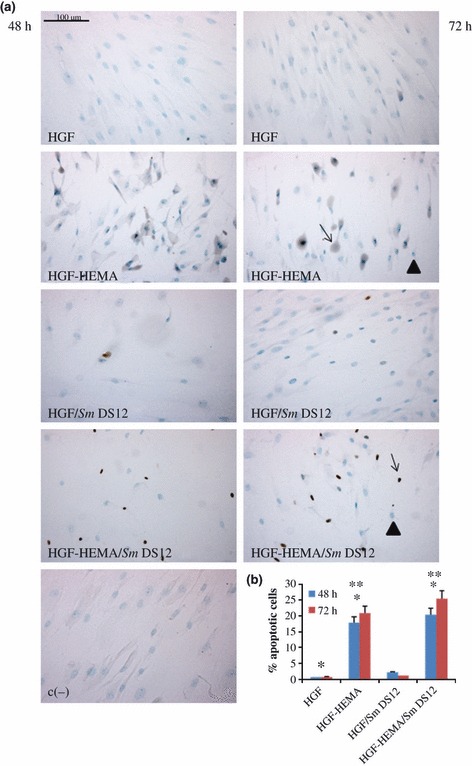
Figure 5.

(a) TUNEL detection of co-cultured human gingival fibroblasts (HGF) apoptotic nuclei in different experimental conditions: HGF-HEMA, HGF/Sm DS12, HGF-HEMA/Sm DS12 and negative control (c−) after 48 h (left panel) and 72 h (right panel) of treatment. Blue staining and arrowheads indicate negative nuclei, and brown staining and arrows indicate positive nuclei. Magnification 20×. (b) Graphical representation of TUNEL analysis. Five slides have been examined per sample. Apoptotic cells have been counted out of a total cell number and expressed as percentage. Physiological levels of apoptotic cells can be detected in HGF and HGF/Sm DS12, and HGF-HEMA shows an increase in apoptotic nuclei percentage, more evident in HGF-HEMA/Sm DS12. Values represented in the graph are means (±SD) n = 3 for all groups. *48 h HGF % apoptotic nuclei versus 48 HGF-HEMA % apoptotic nuclei P < 0.01; *72 h HGF % apoptotic nuclei versus 72 h HGF-HEMA % apoptotic nuclei P < 0.01; *48 h HGF % apoptotic nuclei versus 48 HGF-HEMA/SmDS12% apoptotic nuclei P < 0.01; *72 h HGF % apoptotic nuclei versus 72 h HGF-HEMA/SmDS12% apoptotic nuclei P < 0.01; **48 h HGF-HEMA % apoptotic nuclei versus 48 h HGF-HEMA/SmDS12% apoptotic nuclei P < 0.05; **72 h HGF-HEMA % apoptotic nuclei versus 72 h HGF-HEMA/SmDS12% apoptotic nuclei P < 0.05. Values of P < 0.05 have been considered significant.
