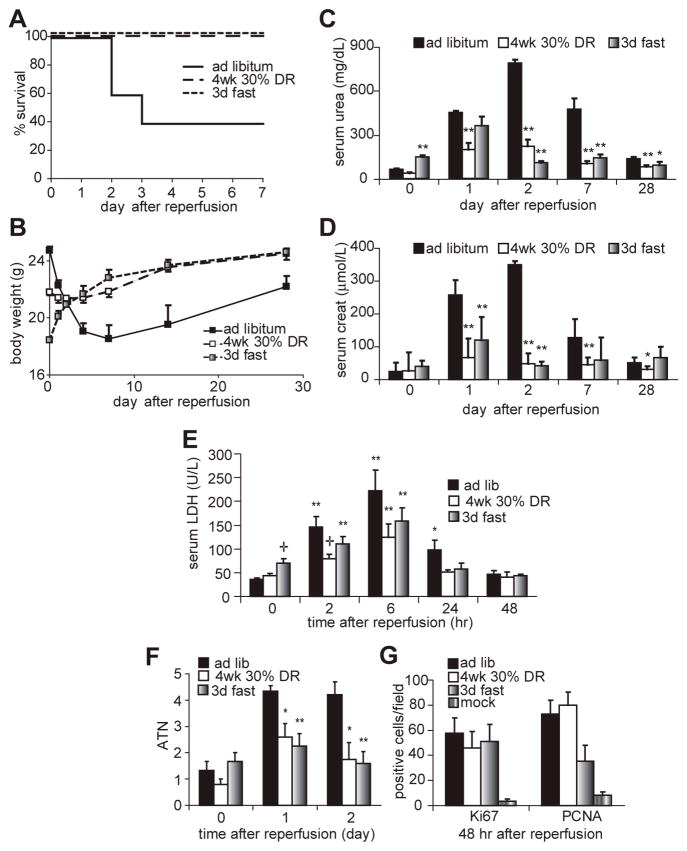
Figure 1. DR protects against the damaging effects of renal IRI.
A. Survival curves of male mice fed ad libitum, restricted to 70% of ad libitum food consumption for 4 weeks, or fasted for 3 days prior to induction of 37 minutes of bilateral renal IRI (n=10 per group). No further mortality was observed beyond day 4 after surgery. Both dietary treatments led to a significant survival advantage by Kaplan Meier analysis (log rank test, p<0.01).
B. Body weight of mice over a 28-day time course following renal IRI.
C, D. Kidney function as measured by serum urea (C) and creatinine (D) concentrations on the indicated days following surgery. Asterisks indicate the significance of the difference as compared to the ad libitum group at the same time point (* p<0.05; ** p<0.01).
E. Blood serum LDH of the indicated groups over a time course following reperfusion. Asterisks indicate significant differences relative to time 0 of the same treatment; crosses represent significant differences relative to the ad libitum group at the indicated time point.
F. Quantification of acute tubular necrosis on a 5 point scale before and after renal IRI based on blind scoring of hemotoxylin/eosin stained kidney sections as described previously (Leemans et al. 2005). Asterisks represent significant differences relative to the ad libitum group at the indicated time point (* p<0.05; ** p<0.01).
G. Percentage of cells expressing Ki67 or PCNA proliferative markers in a microscopic field of the indicated group on the second day following IRI. All groups were significantly elevated vs. the mock control.

