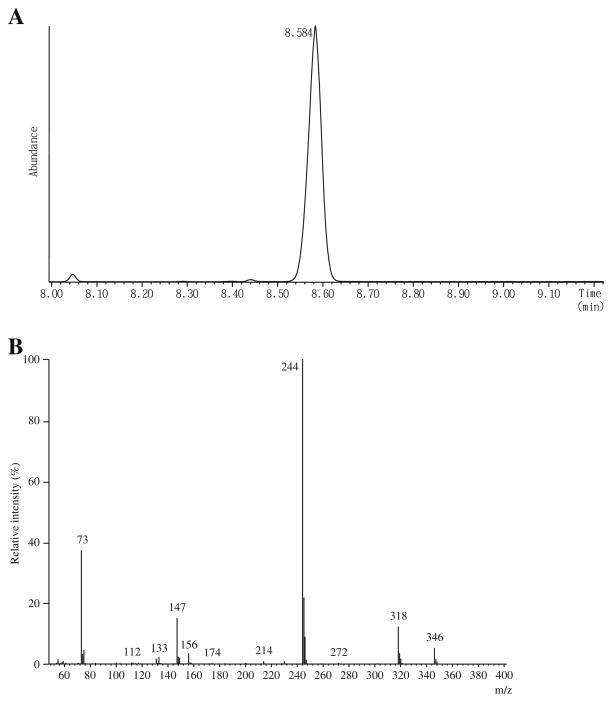
Fig. 2.
GC/MS of KGM. A Elution profile of the TMS derivative of KGM analyzed according to the method of Kuhara [20]. The small peak at 8.05 min is due to 5-oxoproline, resulting from cyclization of glutamine during the preparation of KGM from glutamine. The y axis represents the TIC. B The mass spectrum of the TMS derivative of KGM. The spectrum is fully consistent with a tris-TMS derivative of KGM lactam (see the text)

