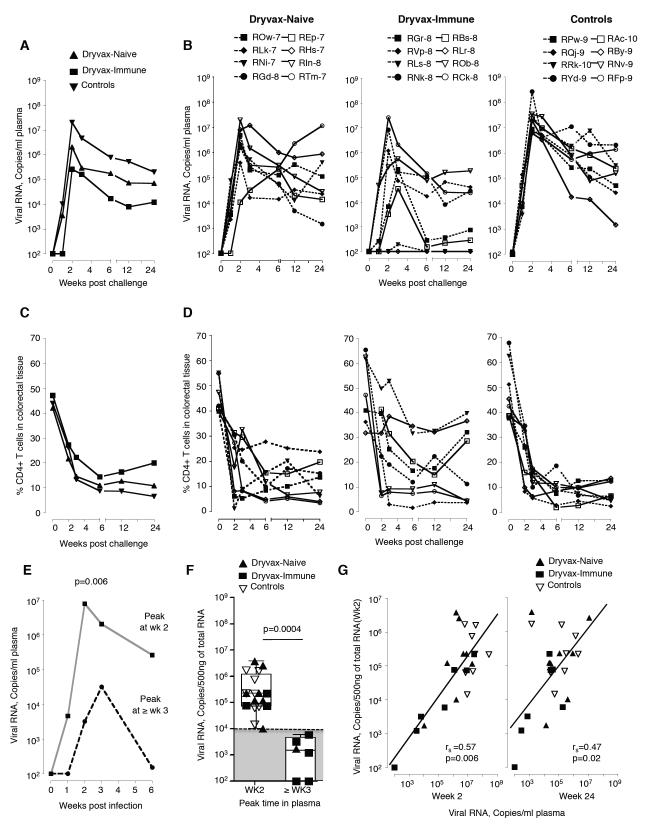
Figure 3. Preexisting VV immunity does not diminish the control of a pathogenic intrarectal SIV challenge.
Temporal viremia (A) median for the group and (B) for individual animals. Frequency of CD4 T cells expressed as a percent of total T cells in the colorectal tissue (C) median for group and (D) for individual animals. Dotted lines indicate Mamu A*01 positive animals and solid lines indicate Mamu A*01 negative animals. (E) Median temporal levels of plasma viral RNA in animals that peaked at week 2 and > week 3. (F) Comparison of colorectal virus at 2 weeks post challenge by time of peak in plasma. Key to animal names is presented in Figure 3B. Boxes represent medians with 25th and 75th percentiles for the group. (G) Correlation between levels of viral RNA in the rectum at week 2 and plasma at weeks 2 and 24. Dryvax-naïve animals are shown in closed triangles (n= 8), Dryvax-immune in closed squares (n= 8) and controls in open triangles (n= 8). The sensitivity of viral load assay was 80 copies of RNA/ml, and animals with levels of virus below 80 were scored at 100. rs, Spearman’s rank correlation.

