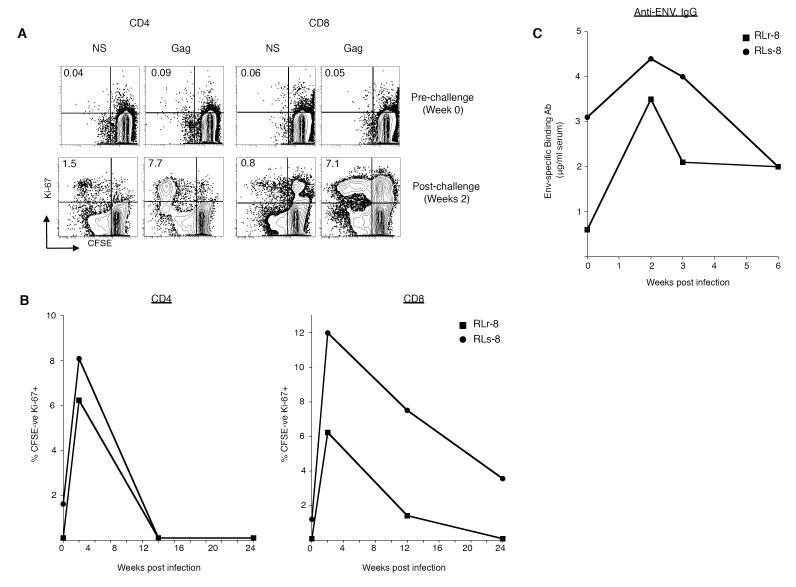
Figure 4. Evidence for ‘take’ of infection in RLr8 and RLs8.
(A) Magnitude of in vitro proliferating (Ki67+, CFSElo) SIV-specific CD4 and CD8 T cells following SIV infection. (A) Representative FACS plots are shown demonstrating the frequency of Gag-specific CD4 or CD8 T cells following in vitro stimulation with a SIV Gag peptide pool for 6 days. Cells were gated on either CD3+ CD4+ or CD3+CD8 + T cells respectively. Numbers on the graphs represent the frequency of proliferating CFSElo Ki67+ T cells as a percent of total CD4 or CD8+ T cells. (B) Magnitude of proliferating SIV-Gag-specific T cells from multiple time points are plotted for CD4 T cells on the left and CD8 T cells on the right. (C) Magnitude of SIV Env-specific binding Ab.

