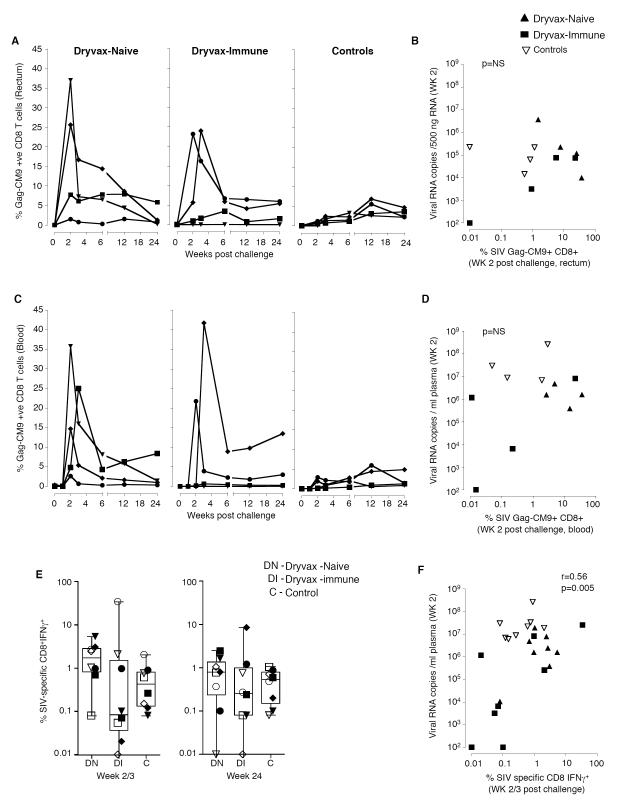
Figure 5. No clear association between the SIV-specific CD8 T cell response and viremia in colorectal tissue early following infection.
(A) Temporal SIV Gag-CM9 specific CD8 T cell responses in the colorectal tissue of Mamu A*01 positive animals. (B) Correlation between tetramer-specific CD8 T cells and levels of virus in the colorectal tissue. (C) Temporal SIV Gag-CM9 specific CD8 T cell responses in blood of Mamu A*01 positive animals. (D) Correlation between tetramer-specific CD8 T cells and levels of virus in blood. (E) SIV (Gag and Env)-specific IFNγ producing CD8 T cells in blood. Boxes represent medians with 25th and 75th percentiles for the group. (F) Correlation between SIV-specific CD8 T cells and levels of virus in blood. Key to animal names is presented in Figure 3B. DN, Dryvax-naïve; DI, Dryvax-immune; C, Controls.

