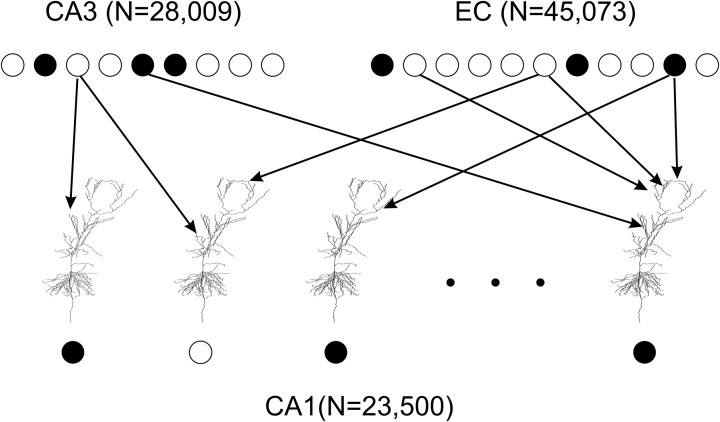
Figure 2.
Connectivity in the model of the CA1 network. 23,500 principal cell models represent a one square millimeter patch of CA1. All neuronal models are identical. However, each model has unique random mapping between its 1918 dendritic tuft synapses and EC cells and between its 4407 upper apical and oblique dendrite synapses and CA3 cells. Spiking EC and CA3 cells (filled circles) may or may not initiate an action potential (filled circle) in a model CA1 principal cell within a 20 ms time window. Thus, the CA1 network model transforms a binary vector of a EC and CA3 input into a binary vector of CA1 activity output.

