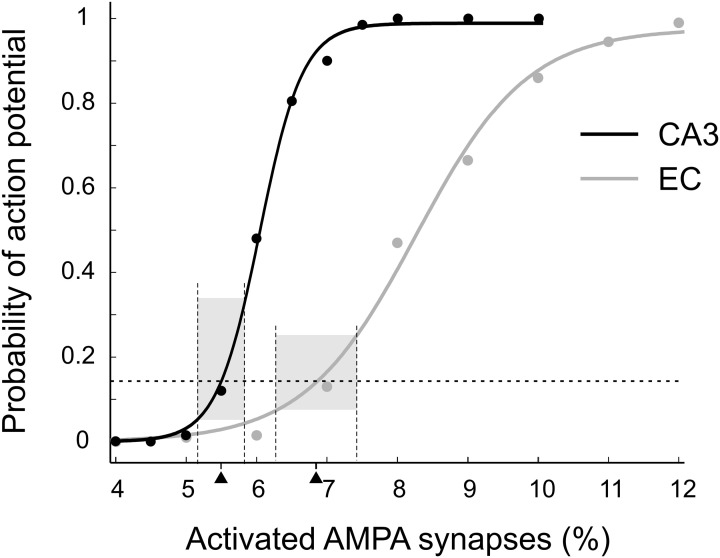
Figure 3.
Probability of action potential initiation in the CA1 principal cell modeled as a function of excitatory drive. EC inputs (gray), CA3 inputs (black). Each point is the portion of 200 random patterns of activated synapses that initiated an action potential. Dashed horizontal line indicates the target action potential probability of 0.14. This probability was achieved when 5.5% of CA3 or 6.85% of EC synapses were activated (black triangles). The bases of the gray boxes centered on the triangles show theoretical variations of activated synapses in the input patterns (see details in the text). The heights of the boxes show corresponding variations in the probabilities of action potential initiation.

