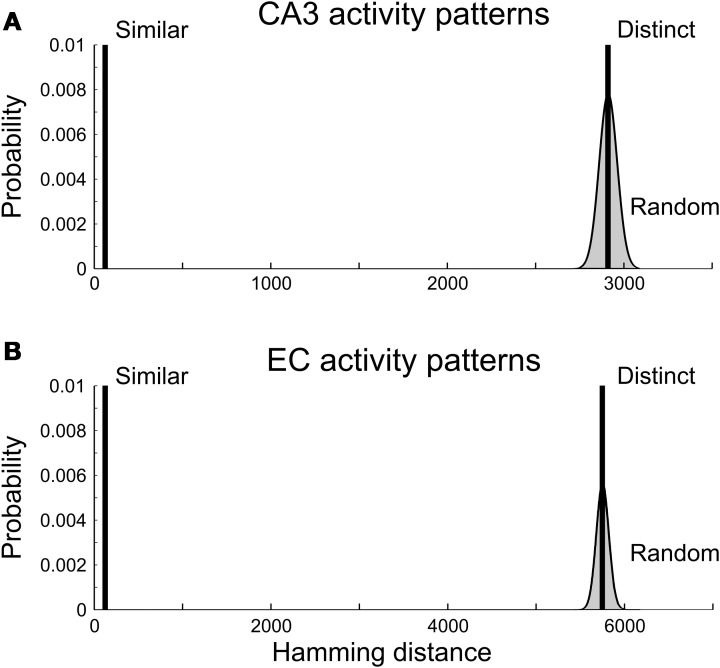
Figure 4.
Hamming distances between presynaptic activity patterns. (A) CA3 activity patterns. (B) EC activity patterns. Vertical bars are truncated; they reach near 1 and represent sets of pattern pairs with equal Hamming distance. Smooth curves bordering gray areas are the normal approximations for the binomial distributions of Hamming distances between all pairs of CA3 (A) and EC (B) activity patterns with 1540 (CA3) and 3086 (EC) spiking neurons. Pairs of “similar” activity patterns had Hamming distances equal to 2% of the maximal possible values of the Hamming distance for patterns. Pairs of “distinct” activity patterns had Hamming distances equal to the mean values of the binomial distributions.

