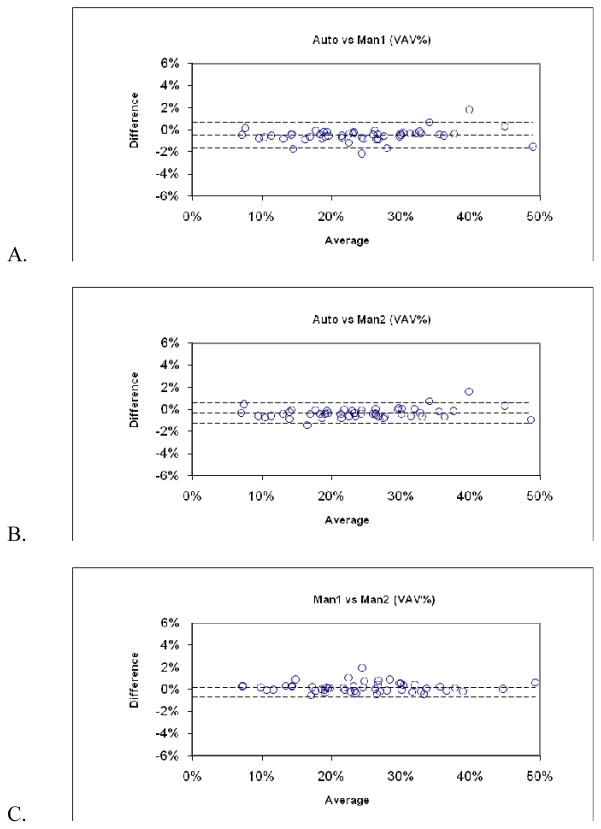
Fig. 2.
Bland-Altman plots of validation experiment (n=50). (A–C) Plots compare pairwise assessments of visceral adipose tissue as a percentage of internal body volume (VAV%) determined by automated software (Auto) and by two observers using manual tracing (Man1 and Man2). The dashed lines indicate the ± two standard deviation limits of agreement. Maximum disagreement was 2% in all three comparisons.

