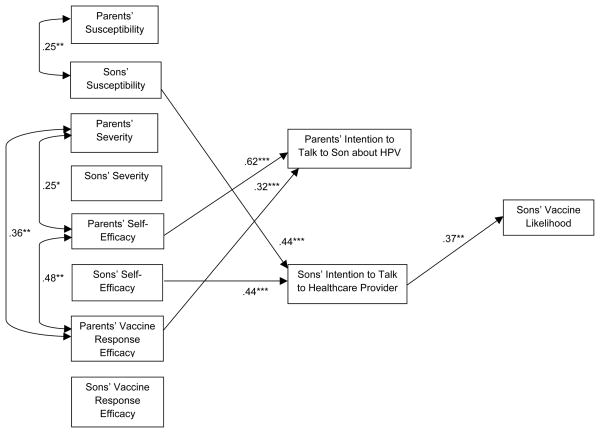
Figure 1.
Model with significant paths and correlations.
Note: *p < .05, **p < .01, ***p < .001. Completely standardized estimates are provided in this figure. All direct and indirect associations from perceived threat and efficacy to vaccine likelihood were examined in the analysis of this model; however, Figure 1 only shows the significant paths and correlations for visual simplicity.

