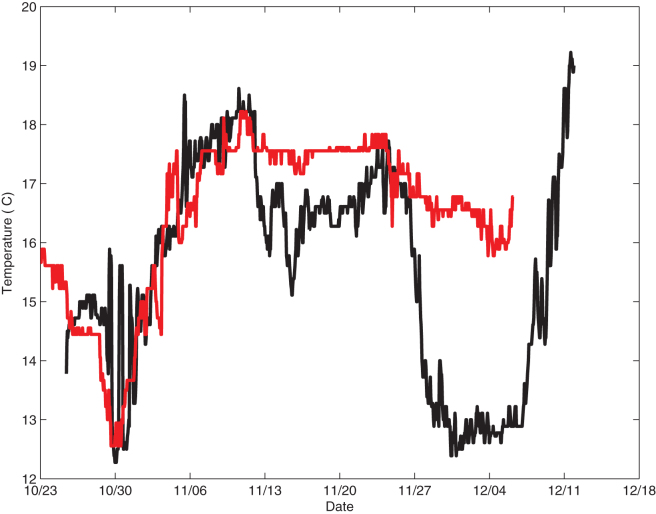
Figure 1. Time series of bottom temperature on the outer continental shelf.
Data from site OC01 is shown red, and data from site TA51 is shown black. The temperature probes were attached to lobster traps at the 77-m and 87-m isobaths, respectively. The two warming events occurred 30 October–10 November and 7–12 December.

