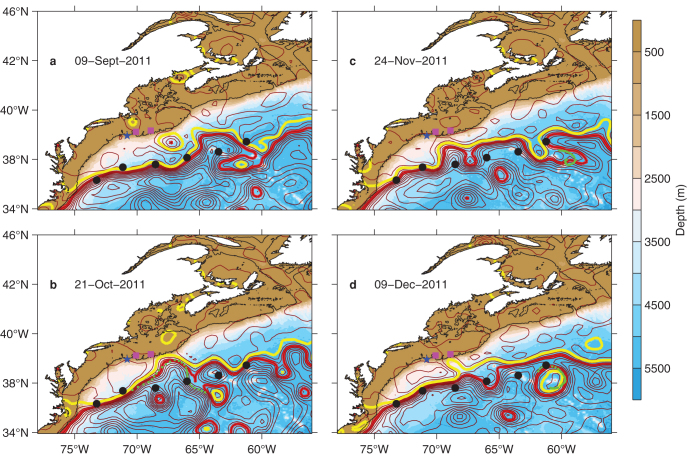
Figure 4. Contours of satellite-derived SSH from Aviso's near-real-time merged absolute dynamic topography.
Contour interval is 10 cm with 40-cm (heavy red) and 10-cm (yellow) contours highlighted. Black dots represent the mean Gulf Stream path determined from SSH gradients along descending altimeter tracks15. Green dots represent the drifter positions over 7 days centered on the individual SSH snapshots. Shading indicates bathymetry in meters, with the 200-m isobath shown by the black contour. Blue star and magenta squares denote the moored profiler and eMOLT sites as in Figure 3.

