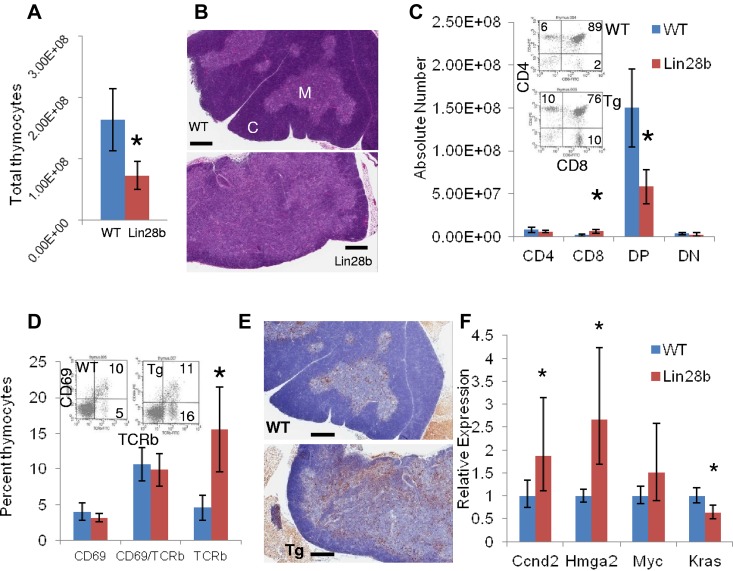
Figure 2.
Developmental abnormalities in the Lin28b thymus. (A) Total thymocyte number in WT (blue) or Lin28b (red) thymi (n = 4). (B) H&E staining of WT or Lin28b whole thymus. M indicates medulla; and C, cortex. Scale bar indicates 400 μm. (C) Absolute numbers from the thymus with representative FACS plots showing percentages (inset; n = 4). (D) Retention of mature CD69−/Tcrb+ cells in the thymus (n = 3). Inset shows representative FACS. (E) B220 staining in the medulla of the thymus. Scale bar indicates 400 μm. *P < .05; ***P < .001. WT is indicated by blue; Lin28b, red. (F) Let-7 target gene expression in the thymi from mice 1-4 months of age (n = 6 per genotype). Samples were compared with the WT samples set at 1. *P < .05.

