Figure 7.
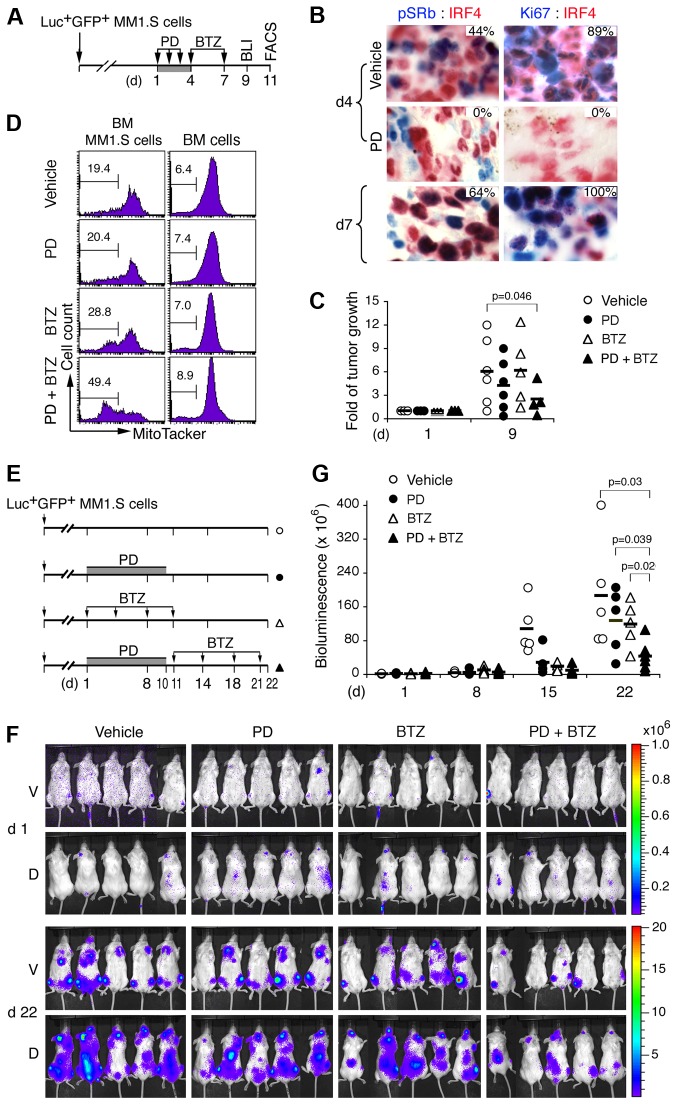
Induction of pG1 and pG1-S enhances tumor suppression by bortezomib. (A) A schema for treatment of NOD/SCID mice developing aggressive tumor after injection with Luc+GFP+MM1.S cells with PD (150 mg/kg) and BTZ (0.25 mg/kg), and the time (day) of BLI and MT− (FACS) analyses. (B) IHC of IRF4 (red) and phospho-Rb (Ser807/811; pSRb, blue) or Ki67 (blue) in MM1.S cells from BM of mice treated as indicated. The percentages of pSRb+ or Ki67+ cells in IRF4+ myeloma cells are indicated. (C) Fold of tumor growth represents BLI on day 9 relative to that on day 1 of the same mice. (D) BM GFP+ MM1.S cells and BM cells were flushed from femurs on day 11, stained with MitoTracker Red, and analyzed by FACS. Number indicates the percentage of MT− cells (mean ± SD). (E) Schema for treatment of myeloma-developing NOD/SCID mice with PD (80 mg/kg) and BTZ (0.25 mg/kg). (F) BLI of tumors in mice on days 1 and 22. (G) Bioluminescence representing tumor mass (photons/s/cm2/steradian) on days indicated. V indicates ventral; and D, dorsal. P value was determined by 2-tailed or 1-tailed (*) t test. Data are representative of 3 independent experiments.

