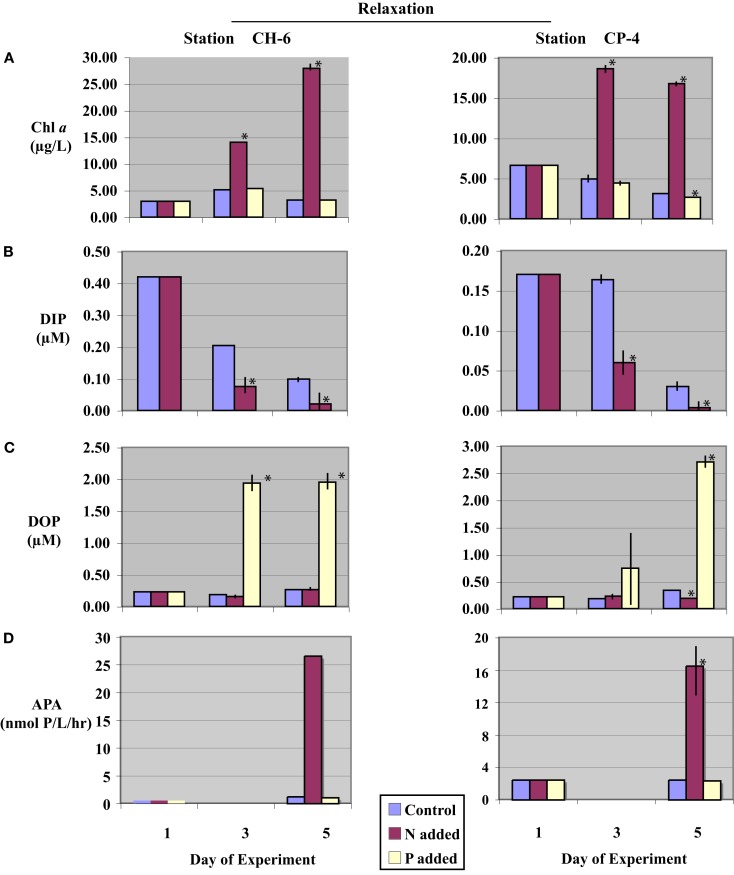
Figure 3.
Time-course incubation results initiated with waters collected during a relaxation event (stations CH-6 and CP-4) and incubated with nitrogen (+N), phosphate (+P), or no addition (control). Initial (day-1) values reflect in situ values, days-3 and -5 reflect concentrations or activities on subsequent days of the incubation. (A) Chl a concentrations; (B) Dissolved Inorganic Phosphorus (DIP) concentrations (data from (+P) treatments are not shown, see text); (C) Dissolved Organic Phosphorus (DOP) concentrations; and (D) Alkaline phosphatase activity (APA), APA was not assayed on day-3. Error bars represent the standard deviation of measurements from triplicate incubation bottles (where not shown, error bars were too small to resolve on the scale of the figure); replicates were not available for initial (day-1) samples. Asterisks (*) denote values significantly different from controls (p < 0.05).

