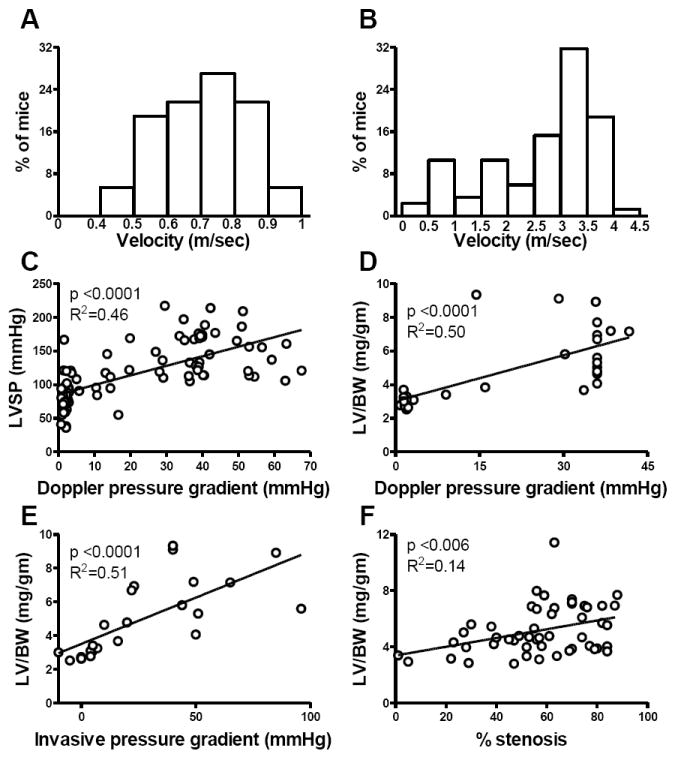
Figure 2. TAC severity.

The distribution of transverse aortic flow velocity in SHAM (A) and TAC (B) mice, the correlation between Doppler derived pressure gradient and LVSP (C) and the correlations between LV/body weight measured at autopsy and Doppler estimated pressure gradient (D), invasively measured gradient (E) and anatomic m-mode estimated percent stenosis (F).
