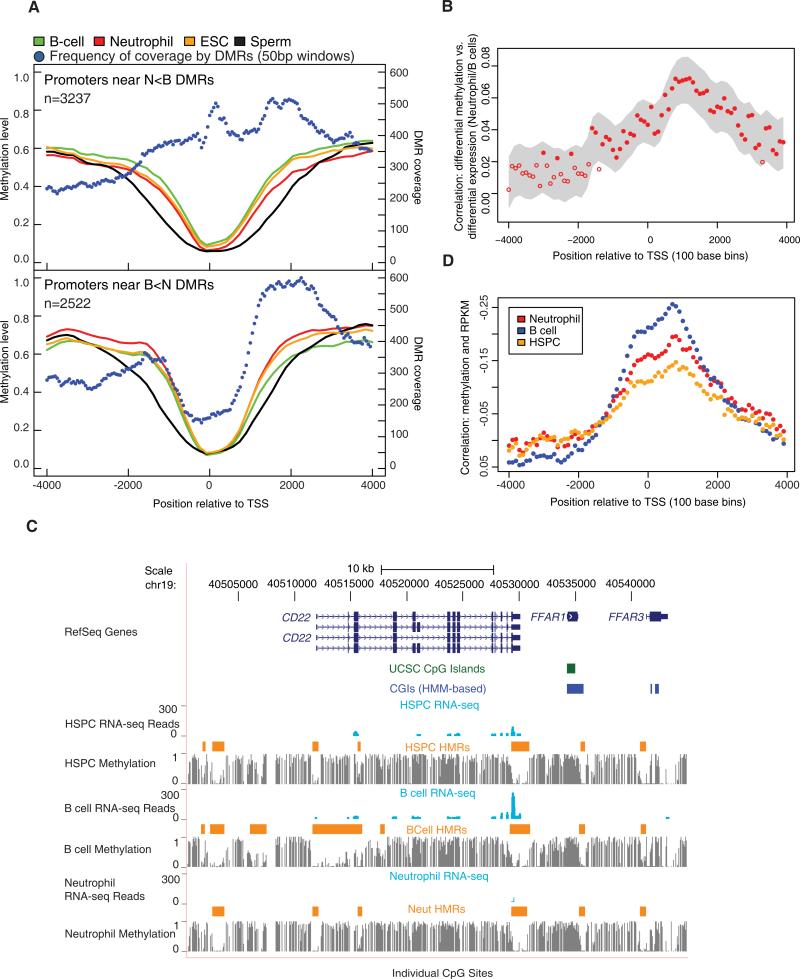
Figure 2. Promoter Differential Methylation and Gene Expression.
(A) Average methylation levels across promoters of genes having a DMR within 4 kb of the TSS are shown. Two separate graphs display neutrophil hypomethylated promoter DMRs relative to B cells (N < B, top) and B cell hypomethylated promoter DMRs relative to neutrophils (B < N, bottom). The number of DMRs covering nonoverlapping 50 bp windows across the promoter is also shown.
(B) Correlations between differential methylation and differential expression between neutrophils and B cells as a function of position relative to the TSS are shown. The correlations were obtained by comparing log odds of differential methylation and log of RPKM. The probability for differential methylation at a given CpG is described in the Supplemental Experimental Procedures. The gray area displays the smoothed 95% confidence interval. The closed circles indicate correlation coefficients that are significantly different from 0.
(C) The browser image shows gene expression for CD22 in the form of mapped read profiles from RNA-seq data. Methylation profiles are also shown (as in Figure 1A) along with HMRs.
(D) Correlations between methylation levels and expression levels represented by RPKM values are shown as a function of position relative to the TSS. Correlation coefficients were averaged in 100 bp bins across regions between 4 kb upstream and downstream of the TSS. Y axis labels were reversed.
See also Figure S3 and Table S2.

