Figure 7.

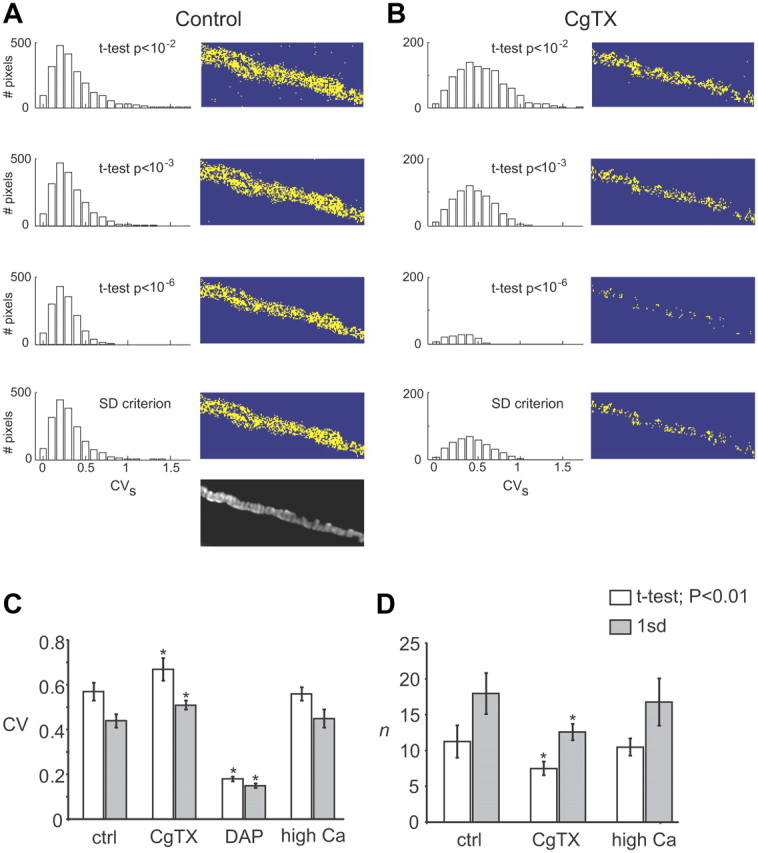
Effects of CgTX on CVs measured using a variety of pixel selection criteria and the summary data for measured CVs values and calculated n values under different treatment conditions. A, Distribution of CVs values (left) and mask for the pixels selected after using different criteria (right), i.e., SD criterion, or a Student's t test using different significance levels (p < 10−2, 10−3, or 10−6) from a representative nerve terminal under control conditions. The grayscale image at the bottom represents the predicted active zone regions of the nerve terminal identified by labeling the postsynaptic acetylcholine receptor clusters with Alexa Fluor 594–α-bungarotoxin. B, Distribution of CVs values (left) and mask for the selected pixels from the same nerve terminal as is A after treatment with 100 nm CgTX for 30 min. C, Summary plot of the calculated CVs values (mean ± SEM) for pixels sampling active zone regions of control nerve terminals (ctrl), those exposed to 100 nm CgTX, 5 μm DAP, or elevated extracellular Ca2+ (3.6 mm; high Ca2+) when using either the SD criterion (gray bars) or a Student's t test (p < 0.01; white bars). D, Summary plot of the calculated number of Ca2+ channels (n) sampled by active zone pixels (mean ± SEM) under control conditions (ctrl), after exposure to 100 nm CgTX, and after increasing extracellular Ca2+ to 3.6 mm (high Ca2+) when using either the SD criterion (gray bars) or a Student's t test (p < 0.01; white bars). *p < 0.05, significantly different from control, one-way ANOVA with Tukey's post hoc test.
