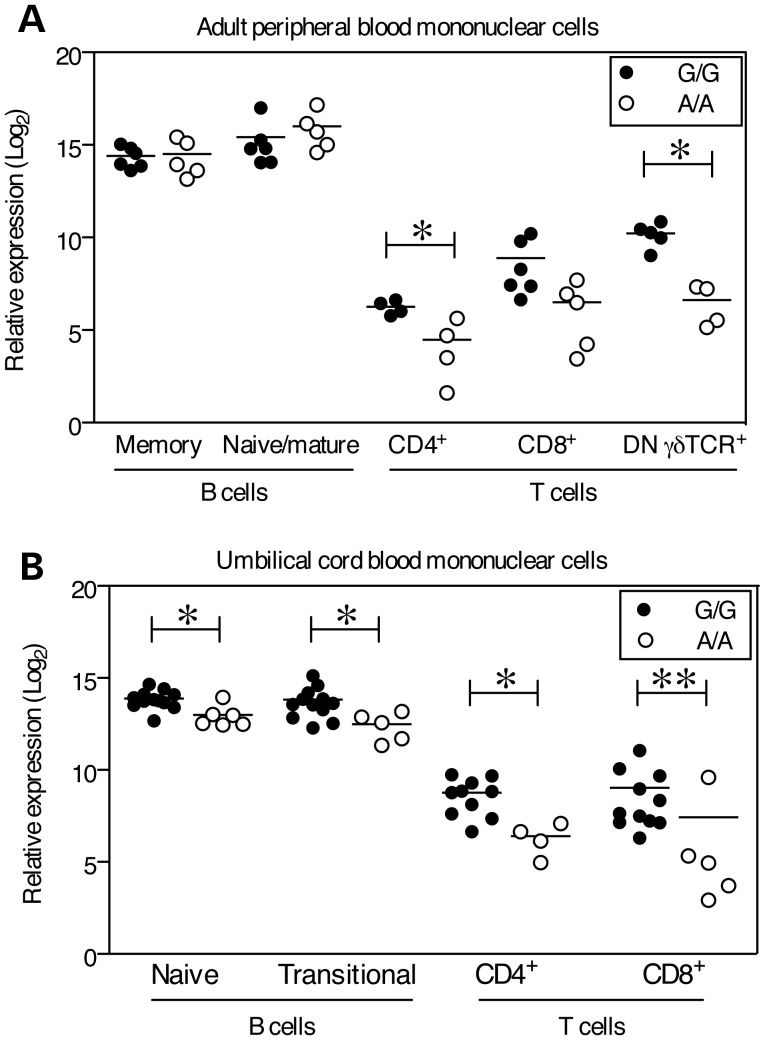
Figure 2.
Lower expression of BLK mRNA in T cells and UCB B cells in rs922483 homozygous risk cells. BLK transcript was measured by qPCR in primary human B and T cell subsets and normalized to GAPDH. rs922438 homozygous A (risk allele) subjects are shown as open circles and homozygous G subjects are shown as filled circles. (A) Adult peripheral blood cell subsets: memory (CD19+CD3−CD27+) and mature/naïve (CD19+CD3−CD27−) B cells, CD4+, CD8+ and CD4−CD8− γδ TCR+ T (CD3+CD19−) cells, (B) UCB cell subsets: naïve (CD19+CD3−CD27−CD10−CD38int) and transitional (CD19+CD3−CD27−CD10+CD38hi) B cells, CD4+ and CD8+ T cells. Statistically significant differences as determined by the Mann–Whitney non-parametric U-test to compare indicated groups are denoted as *P <0.05 and **P <0.01 and the mean is represented by a horizontal line.

