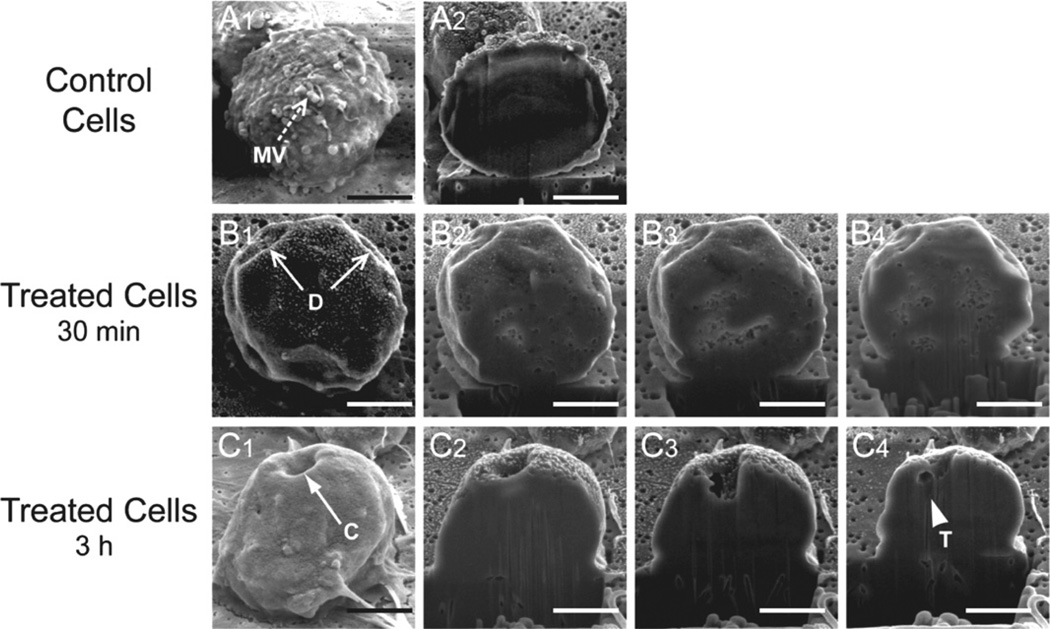
Fig. 3.
SEM images of LtxA-treated Jn.9 cells.
A. Jn.9 cell, which has not been exposed to LtxA. This control cell was sliced coronally with a Ga3+ FIB (A1).
B. Jn.9 cell exposed to LtxA (1 × 10⁻⁹ M) for 30 min.
C. Jn.9 cell exposed to LtxA (1 × 10⁻⁹ M) for 3 h. The toxin-treated cells were serially sliced coronally with the FIB (B2–B4 and C2–C4).
MV, microvilli; D, depression; C, cavity; T, tear. Bar = 5 µm.

