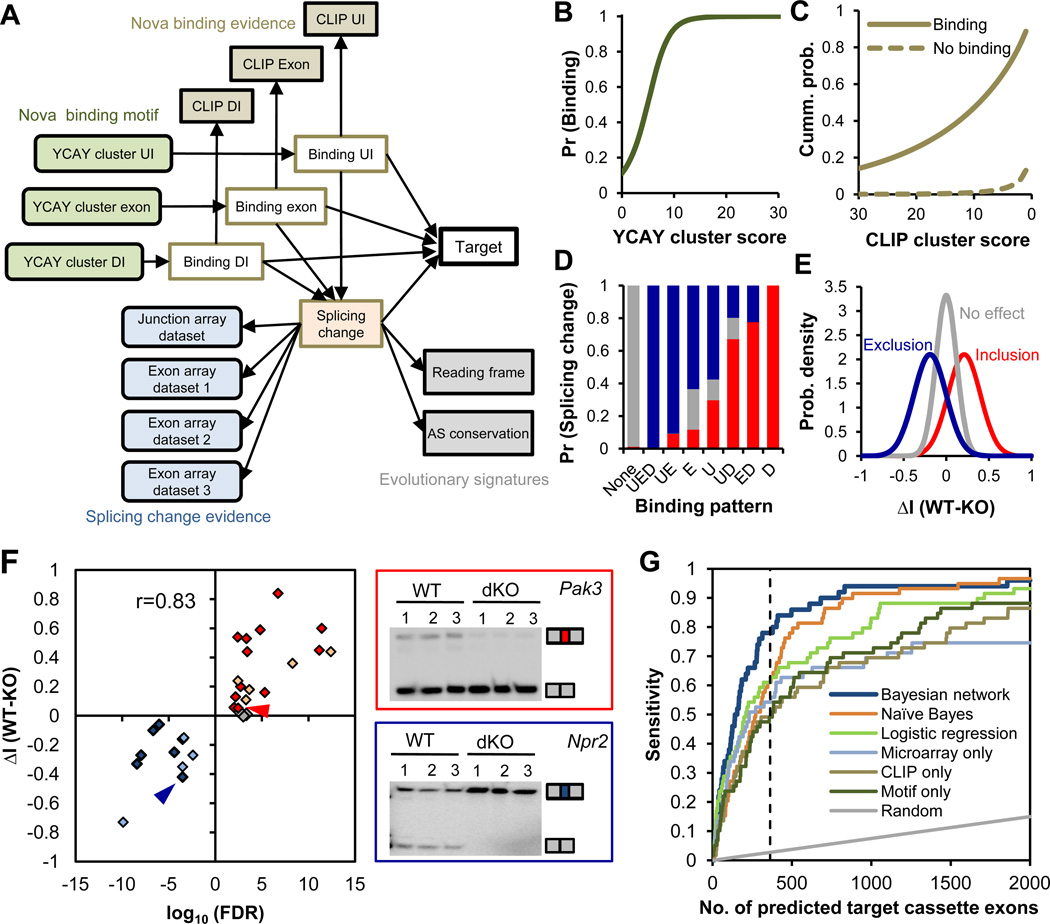
Figure 1. Integrative prediction of Nova targets using a Bayesian network.
The Bayesian network (BN) for cassette exons is shown. (A) Design of the BN. The 17 nodes (variables) model four types of data, including YCAY clusters and CLIP clusters in each cassette exon or flanking upstream (UI) and downstream introns (DI), splicing microarrays comparing WT and Nova KO brains, and evolutionary signatures. See table S3 for more details. (B–E) Estimated conditional probability distributions (CPDs) derived from the BN. (B) The probability of Nova binding to regions with varying YCAY cluster scores across all regions. (C) The cumulative probability of CLIP cluster scores across all regions with or without inferred Nova binding. (D) The probability of exons showing Nova-dependent inclusion (red), exclusion (blue), or no effect in comparisons of WT versus Nova KO brain transcripts, given the indicated combinatorial Nova binding patterns in exon (E), upstream (U) and downstream (D) introns. (E) The distribution of proportional splicing changes between WT and Nova KO brain RNA (ΔI, ref. (10)) measured by exon-junction arrays for exons with inferred Nova-dependent inclusion, exclusion or without Nova regulation. (F) A summary of RT-PCR analysis for the 31 exons tested in WT versus Nova KO brains. Twenty-two exons have Nova-regulated inclusion or exclusion (P<0.05; t-test), and those without significant changes tested in this study are shown in red, blue and gray, respectively; 9 previously validated exons are similarly shown in light red and light blue, respectively. The correlation between prediction confidence and the magnitude of splicing change is indicated. For two representative BN-predicted exons (arrow heads in the scatter plot), gel images are shown with the two isoforms including or excluding the regulated exon indicated (right panel). (G) Comparison of Nova target prediction by different methods (Bayesian network, naïve Bayes, and logistic regression) or using individual datasets (microarrays comparing E18.5 WT versus Nova1/2 double KO brains, CLIP clusters, and YCAY clusters). Each curve represents the prediction sensitivity with varying stringency; the performance of random predictions is also shown. The dotted line indicates the top 363 predictions.

