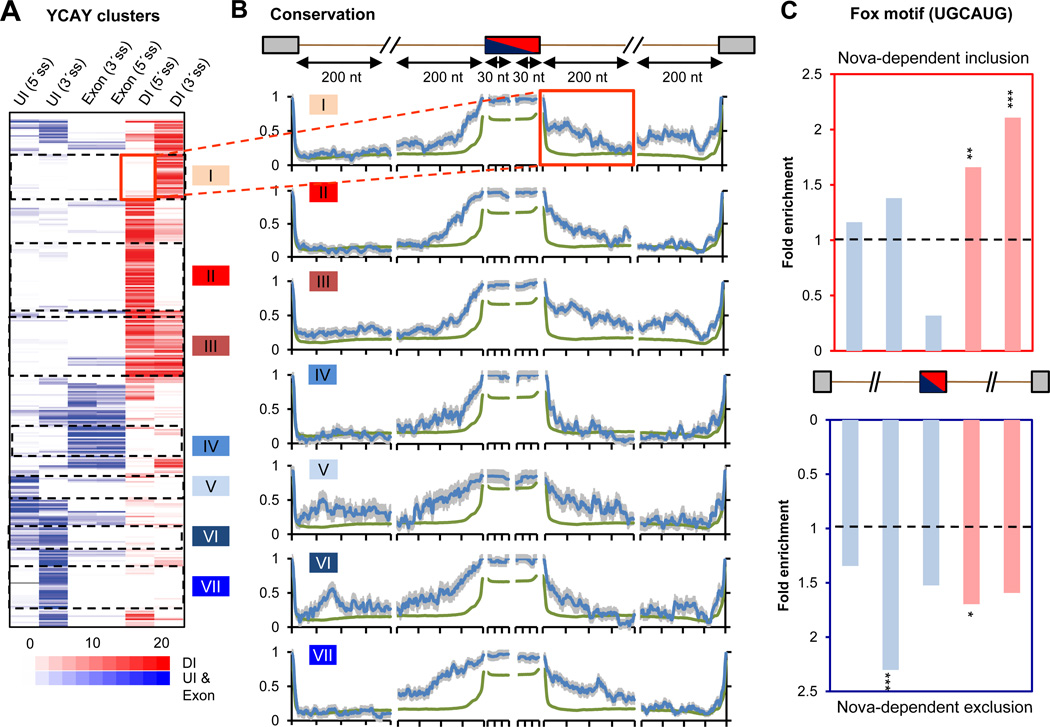
Figure 2. Combinatorial regulation of Nova target exons.
(A) Hierarchical clustering of 325 non-redundant Nova-regulated cassette exons using six regional YCAY cluster scores in exon, UI and DI relative to alternative splice sites. The position of DI and UI/exonic YCAY clusters is predicted to dictate Nova-regulated alternative exon inclusion (red) or exclusion (blue). Seven clusters of exons with distinct Nova-binding patterns are shown. (B) Sequence conservation scores across 20 mammalian species were extracted for 30 nt exonic regions near 5´ or 3´ splice site of the regulated exon, or for 200 nt intronic regions near all four possible splice sites, as indicated in the cartoon. The average conservation profile is shown for each cluster in (A) (blue), using all cassette exons as a control (green). Error bars represent standard errors. The flanking intronic region downstream of the cassette exon in cluster I is highlighted. (C) The enrichment of the Fox motif (UGCAUG) in exons with Nova-regulated inclusion (top) or exclusion (bottom), as compared to control cassette exons. Fox-binding sites predicted to dictate Fox-regulated exon inclusion (DI) or exclusion (UI/exon) are represented by red and blue bars, respectively. Statistical significance is derived from a χ2 test (*: P<0.05; **: P<0.01; ***: P<0.001).

