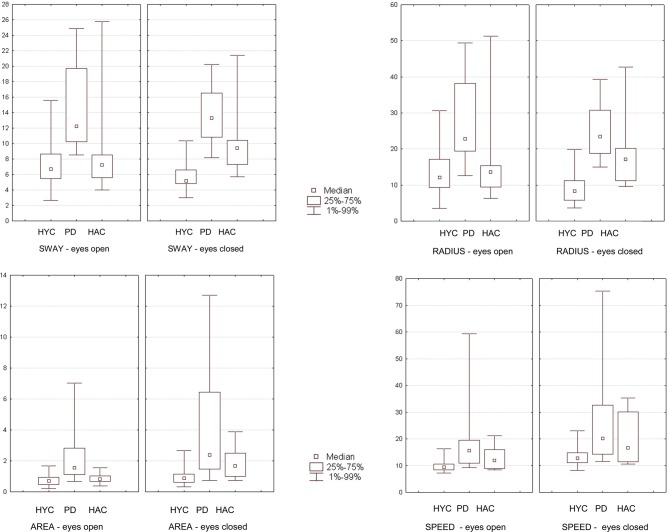
Figure 3.
The results of the group comparison in the Romberg-test with eyes open and eyes closed are presented graphically as box plots (HYC = healthy young control; PD = patients with Parkinson's disease; HAC = healthy adult control). Statistical significant findings are seen especially with closed eyes.

