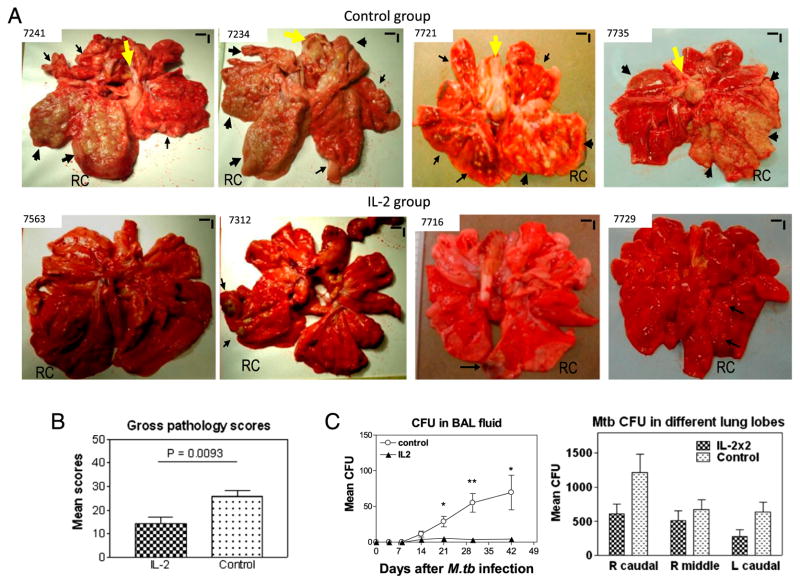
FIGURE 3.
IL-2 treatments during early M. tuberculosis infection, while expanding Treg and T effectors, surprisingly conferred resistance to severe TB lesions, without causing Treg-associated increases in M. tuberculosis bacterial burdens. (A) Digital photos of cut sections of lung lobes from 8 representatives of 18 macaques (9 IL-2 treated and 9 controls treated with saline or BSA). Lungs and other organs were obtained in complete necropsy at day 65 after M. tuberculosis infection. Macaque ID numbers are shown in upper left corners, with the RC lobe (infection site) indicated in each photo. Extent and severity of the lesions could be adjudged based on the examples pointed by large arrows for caseation pneumonia or extensive coalescing granulomas and by small arrows for less coalescing or small granulomas. Yellow arrows indicate the enlarged hilar lymph nodes with caseation. Note that the IL-2–treated macaque ID 7563 did not show any detectable gross TB lesions, although small microscopic granulomas were detected in histology sections of the RC lobe. Additional 5 IL-2–treated macaques displayed focal or less-coalescing granulomas mostly limited to the RC lobe, without apparent occurrence of enlarged hilar lymph nodes. Small vertical/horizontal bars at upper right corner of each photo represent the 1-cm scale derived from the fluorescence rulers of original photos. Greater than 50% of controls versus 10% of IL-2–treated macaques had extrathoracic TB dissemination. The efficacy evaluation was done sequentially in three separate trials using a total of 18 macaques. (B) Mean gross pathology scores for IL-2–treated and control groups. The scores were calculated and compared, as we previously described (22). (C) Simultaneous expansion of Foxp3+ Treg and T effector populations did not result in Treg-associated increases in bacterial burdens in lungs. Shown are mean CFU counts in BAL fluid over time before the end time point (left) and in lung tissue homogenates (right) of different lung lobes collected at the end point from IL-2–treated and control groups. A total of 10 ml BAL fluid/cells and 10 ml lung tissue homogenates was used for CFU enumeration, respectively. The significantly higher M. tuberculosis CFU in BAL fluid were seen in the control group (C, left), and this might be due to the fact that TB necrosis process was taking place and releasing more bacterial organisms into the airway over time before the end point. p < 0.05 for comparisons in BAL at weeks 3–6; p > 0.05 for comparisons of CFU counts in tissue homogenates of RC, right middle, and left caudal lung lobes between the IL-2–treated and control groups. n = 9/group. *p < 0.05, **p < 0.01.

