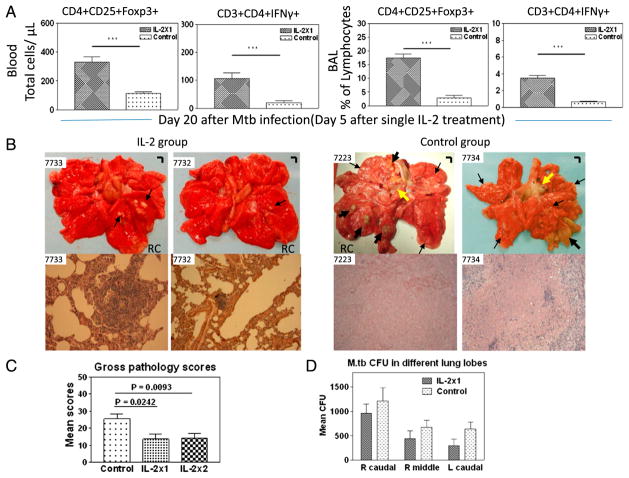
FIGURE 6.
Postinfection IL-2 treatment starting at day 15 after pulmonary M. tuberculosis infection also induced increases in Foxp3+ Treg and T effector cells, and conferred resistance to severe TB lesions in four IL-2–treated M. tuberculosis-infected macaques. Gross pathology analyses for single IL-2 treatment group were also done at day 65 after M. tuberculosis infection. (A) Representative data showing IL-2 expansion of Foxp3+ T cells and T effectors at day 5 (peak expansion) after single IL-2 treatment (day 20 after M. tuberculosis infection). n = 4 for IL-2 group. Major expansion of other CD4+ T, CD8+ T, and γδ T effector cells was also seen in blood and BAL fluid (data not shown). (B) Representative gross pathology in cut sections and representative histopathology. Original magnification ×200 for IL-2 group, ×100 for Control group. (C) Comparative pathology scores between 1× IL-2–treated, 2× IL-2–treated, and control groups. (D) IL-2 treatment, while expanding Treg and T effectors, does not cause Treg-associated increases in M. tuberculosis burdens. ***p < 0.001.

