
Figure 1. Capillary telangiectasia.
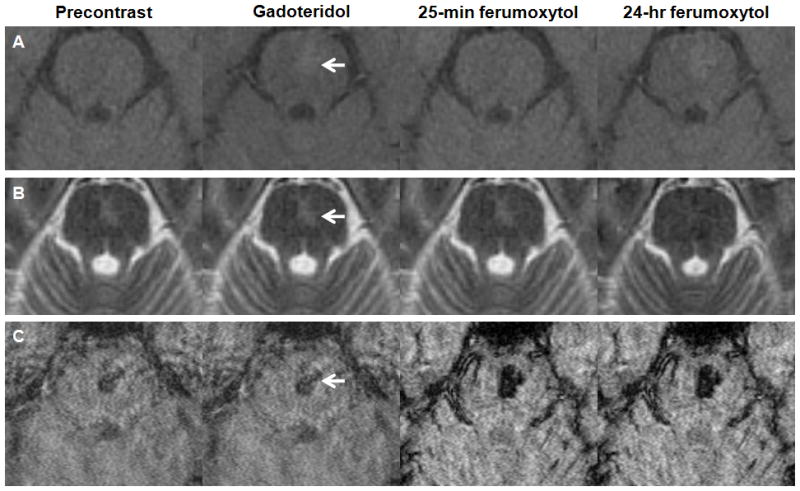
A–C, Axial T1- (A), T2- (B), and susceptibility-weighted images (C) obtained before, after gadoteridol, 25 minutes, and 24 hours after ferumoxytol administration. The gadoteridol and the 24-hour ferumoxytol T1-weighted MRI show a faint enhancing lesion in the pons (arrow). The capillary telangiectasia is isointense on the T2-weighted ferumoxytol images at 24 hours. The lesion demonstrates prominent signal loss on the susceptibility-weighted ferumoxytol scans.