
Figure 2. Cavernoma and capillary telangiectasia.
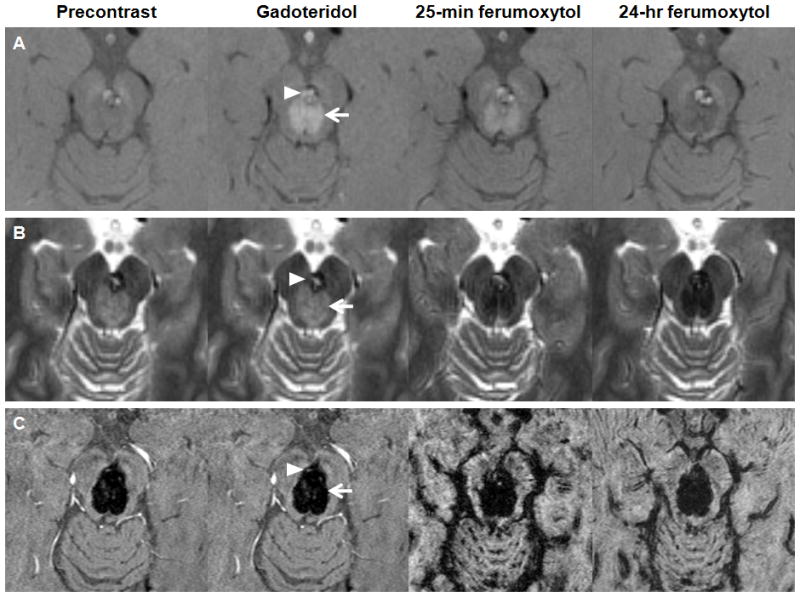
A–C, Axial T1- (A), T2- (B), and susceptibility-weighted images (C) obtained before, after gadoteridol, 25 minutes, and 24 hours after ferumoxytol administration. The gadoteridol MRI shows enhancing lesions: a capillary telangiectasia (arrow) and a cavernoma (arrowhead) in the mesencephalon. The capillary telangiectasia is hyperintense at 25 minutes and hypointense at 24 hours on the T1-weighted images. The cavernoma, which has a T1 iso-, T2 hyperintense core and a T2 hypointense rim on the precontrast images, shows signal increase at 25 minutes and mixed ferumoxytol-related signal changes at 24 hours on the T1-weighted scans. Both lesions demonstrate signal loss on the T2- and susceptibility-weighted ferumoxytol images.