
Figure 5. Spinal cord arteriovenous malformation.
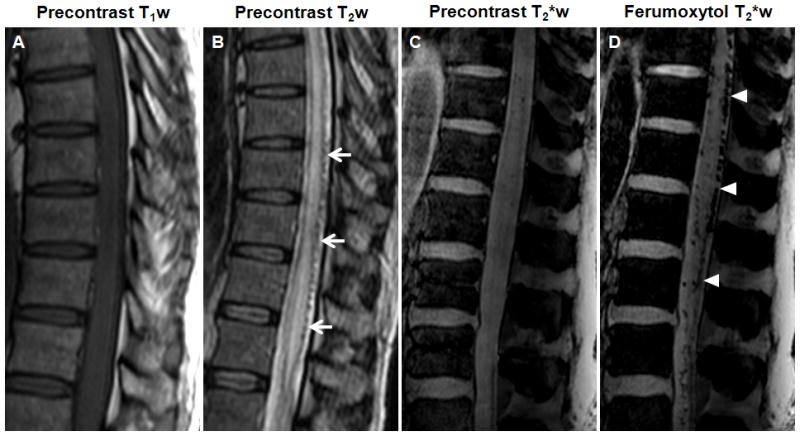
A–D, Sagittal T1- (A), T2-(B), and T2*-weighted images (C) obtained before and T2*-weighted images obtained 25 minutes after ferumoxytol administration (D). The T2-weighted image shows abnormally increased intrinsic cord signal. Dorsal flow voids are visible (arrows). The abnormal tangle of blood vessels on the spinal cord is hypointense with ferumoxytol on the T2*-weighted images (arrowheads).