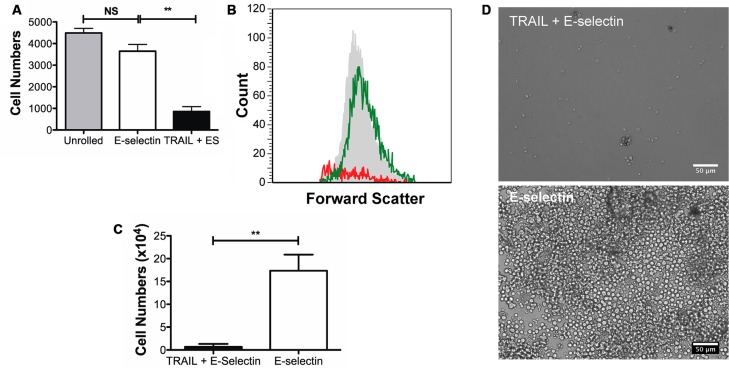
Figure 5.
Effect of pretreatment with 1 mM aspirin and rolling. (A) Cell counts from flow cytometry (B) Representative histograms 18 h after the flow experiments. The gray shaded histogram represents cells that were obtained from culture, green histogram represents the cells obtained from the E-selectin tube while the red histogram represents cells obtained from the TRAIL + ES tube. (C) Cell counts after 3 days in culture; following 2 h of flow device exposure. (D) Representative micrographs after 3 days in culture. Scale bar is 50 μm. **p < 0.01.

